
2022 State of the Industry Report
The pandemic’s worst may be over as confidence returns for the vast majority of sign companies.
COMPARED TO OUR previous report from the end of 2020, with the COVID-19 pandemic having taken a devastating toll, our report for 2022 indicates marked improvement and considerable strength. Back then, real GDP had fallen during 2020’s second quarter by an astounding 31.4%, “numbers not seen since the Great Depression,” according to Forbes. In contrast, real GDP increased 5.7% in 2021, per the US Government’s Bureau of Economic Analysis. Further, the US economy has experienced growth every quarter since 2020 Q2 to the writing of this report (early February 2022).
Growth is up but so is inflation. “U.S. Inflation Hits 39-Year High of 7%, Sets Stage for Fed Hike,” reads a recent headline for Bloomberg News. Higher wages and salaries have driven some of the inflation, according to the US Bureau of Labor Statistics, with wages rising 4.5% for the 12-month period ending in December 2021 (vs. 2.6% for the same period ending December 2020). Meanwhile, the unemployment rate has fallen below 4%, also recently reported by Bloomberg.
Closer to our industry, the International Sign Association’s recently released Quarterly Economic Report predicts that GDP is expected to grow at 4.1% for 2022, down slightly from 2021. Inflation is anticipated to be 4.2%. Steel prices are expected to drop as demand falls and lumber prices are also predicted to decrease in 2022 Q1.
Through it all, the sign industry has carried on remarkably consistently in areas related to electric and non-electric sign sales and types. Confidence in sales and profitability has returned among the vast majority of the respondents, with tomorrow and the days after looking pretty, pretty, pretty good.
RESPONDENTS
AND EMPLOYEES
76% identifying as independently owned sign companies.
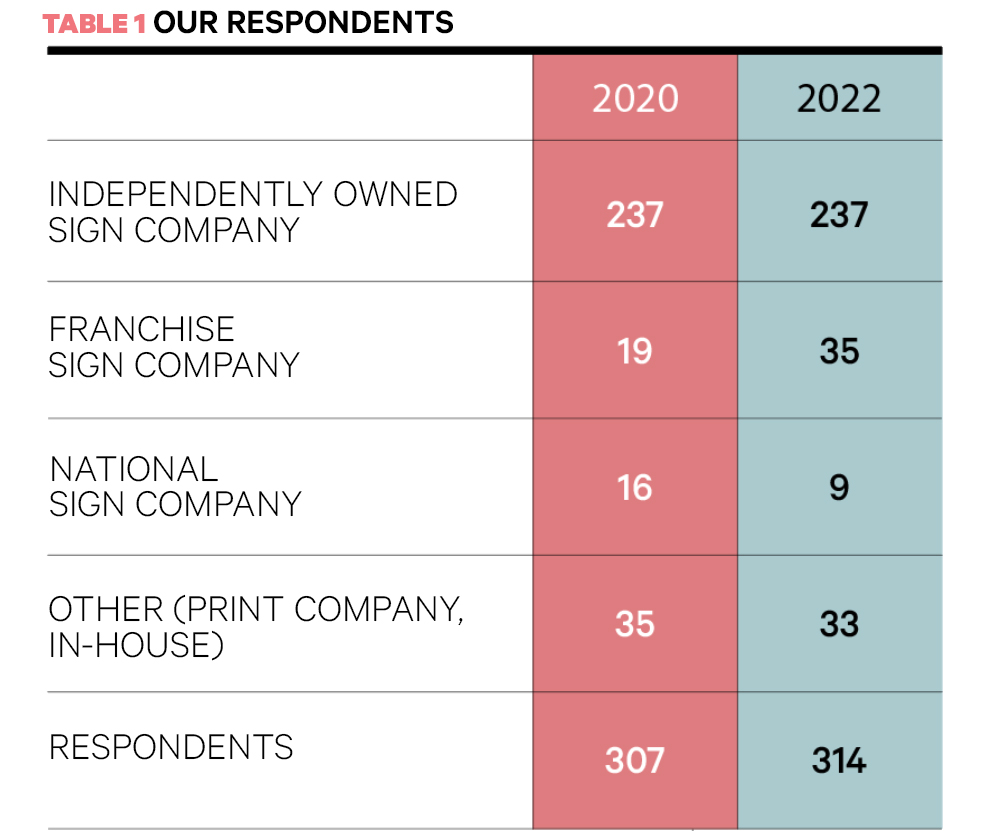
We collected 314 responses to our survey, with nearly 76% identifying as independently owned sign companies, just over 11% as franchise sign companies and slightly fewer than 3% as national sign companies — compared to a mix of 77%, 6% and 5% from our 2020 survey — so more franchise and fewer national companies are represented this year (Table 1). The remaining 10% chose “other” and so their data was not included in this report.
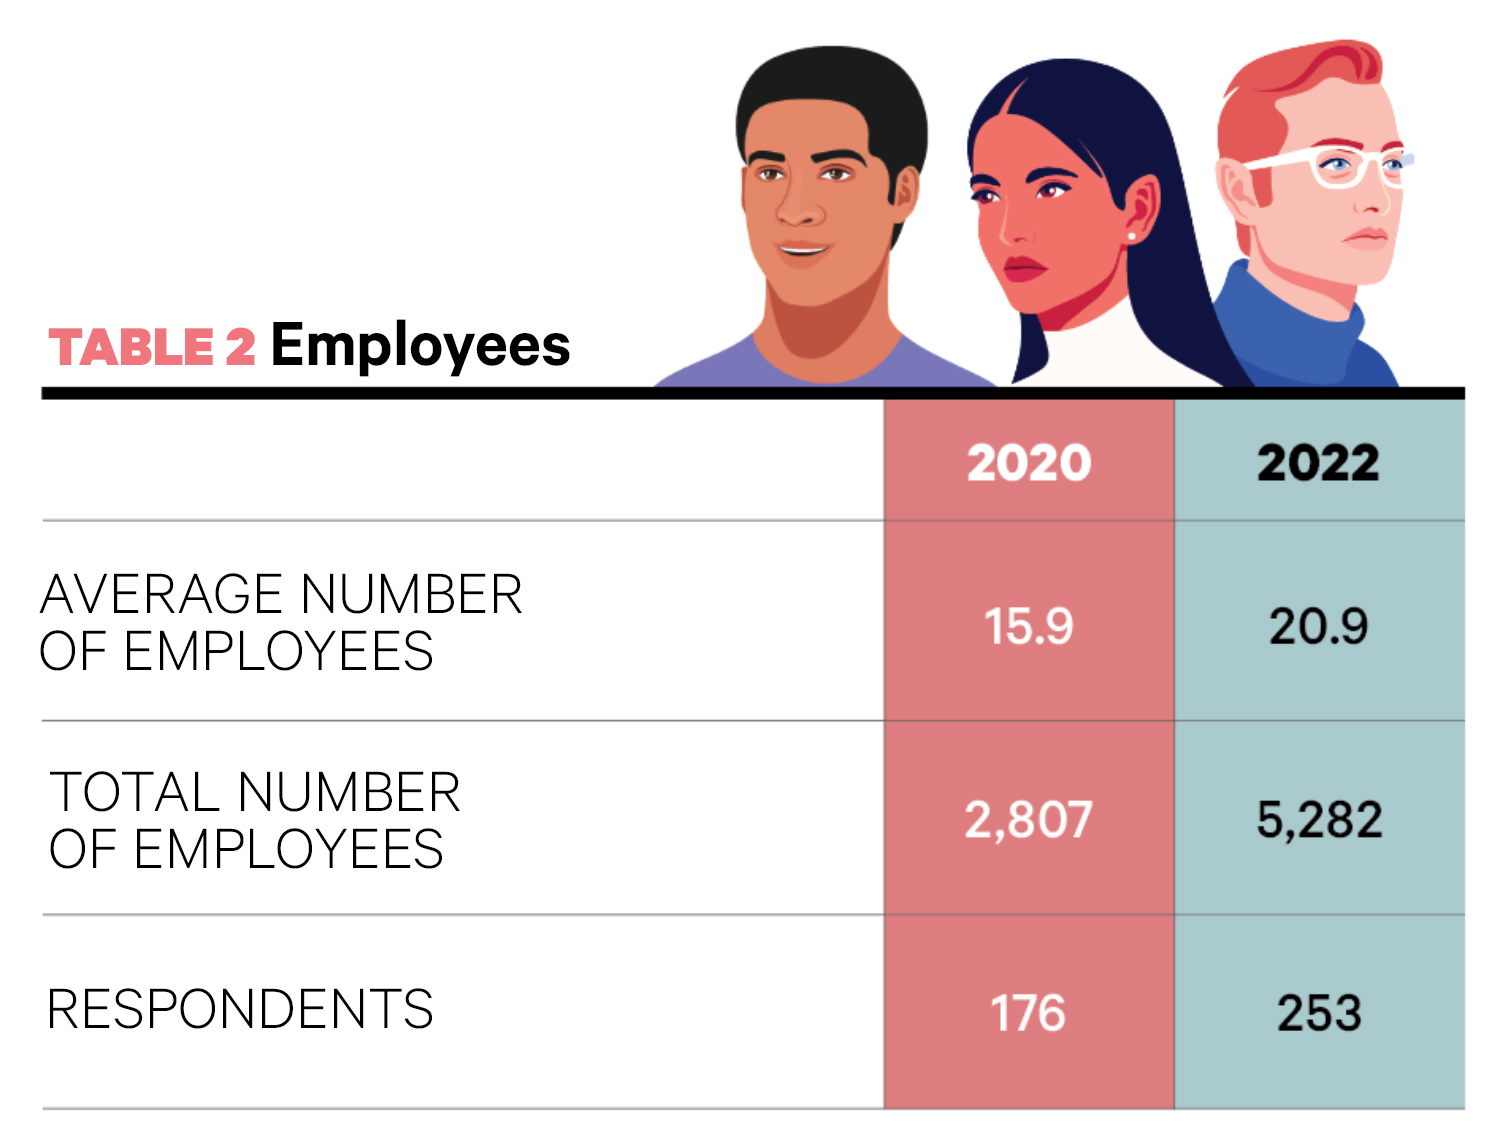
This year, 253 respondents report they have an average of 20.9 full-time-equivalent employees, compared to an average of 15.9 in 2020 (Table 2). Nine of the companies state having more than 100 FTEs, including one with 500 and another with 850, and only 37 (14.6%) of the respondents report 21 or more employees, so the average is affected by the few larger companies. It’s safe to say that more than 85% of sign companies responding to this survey employ fewer than 20 employees.
SALES
AND PROFITS
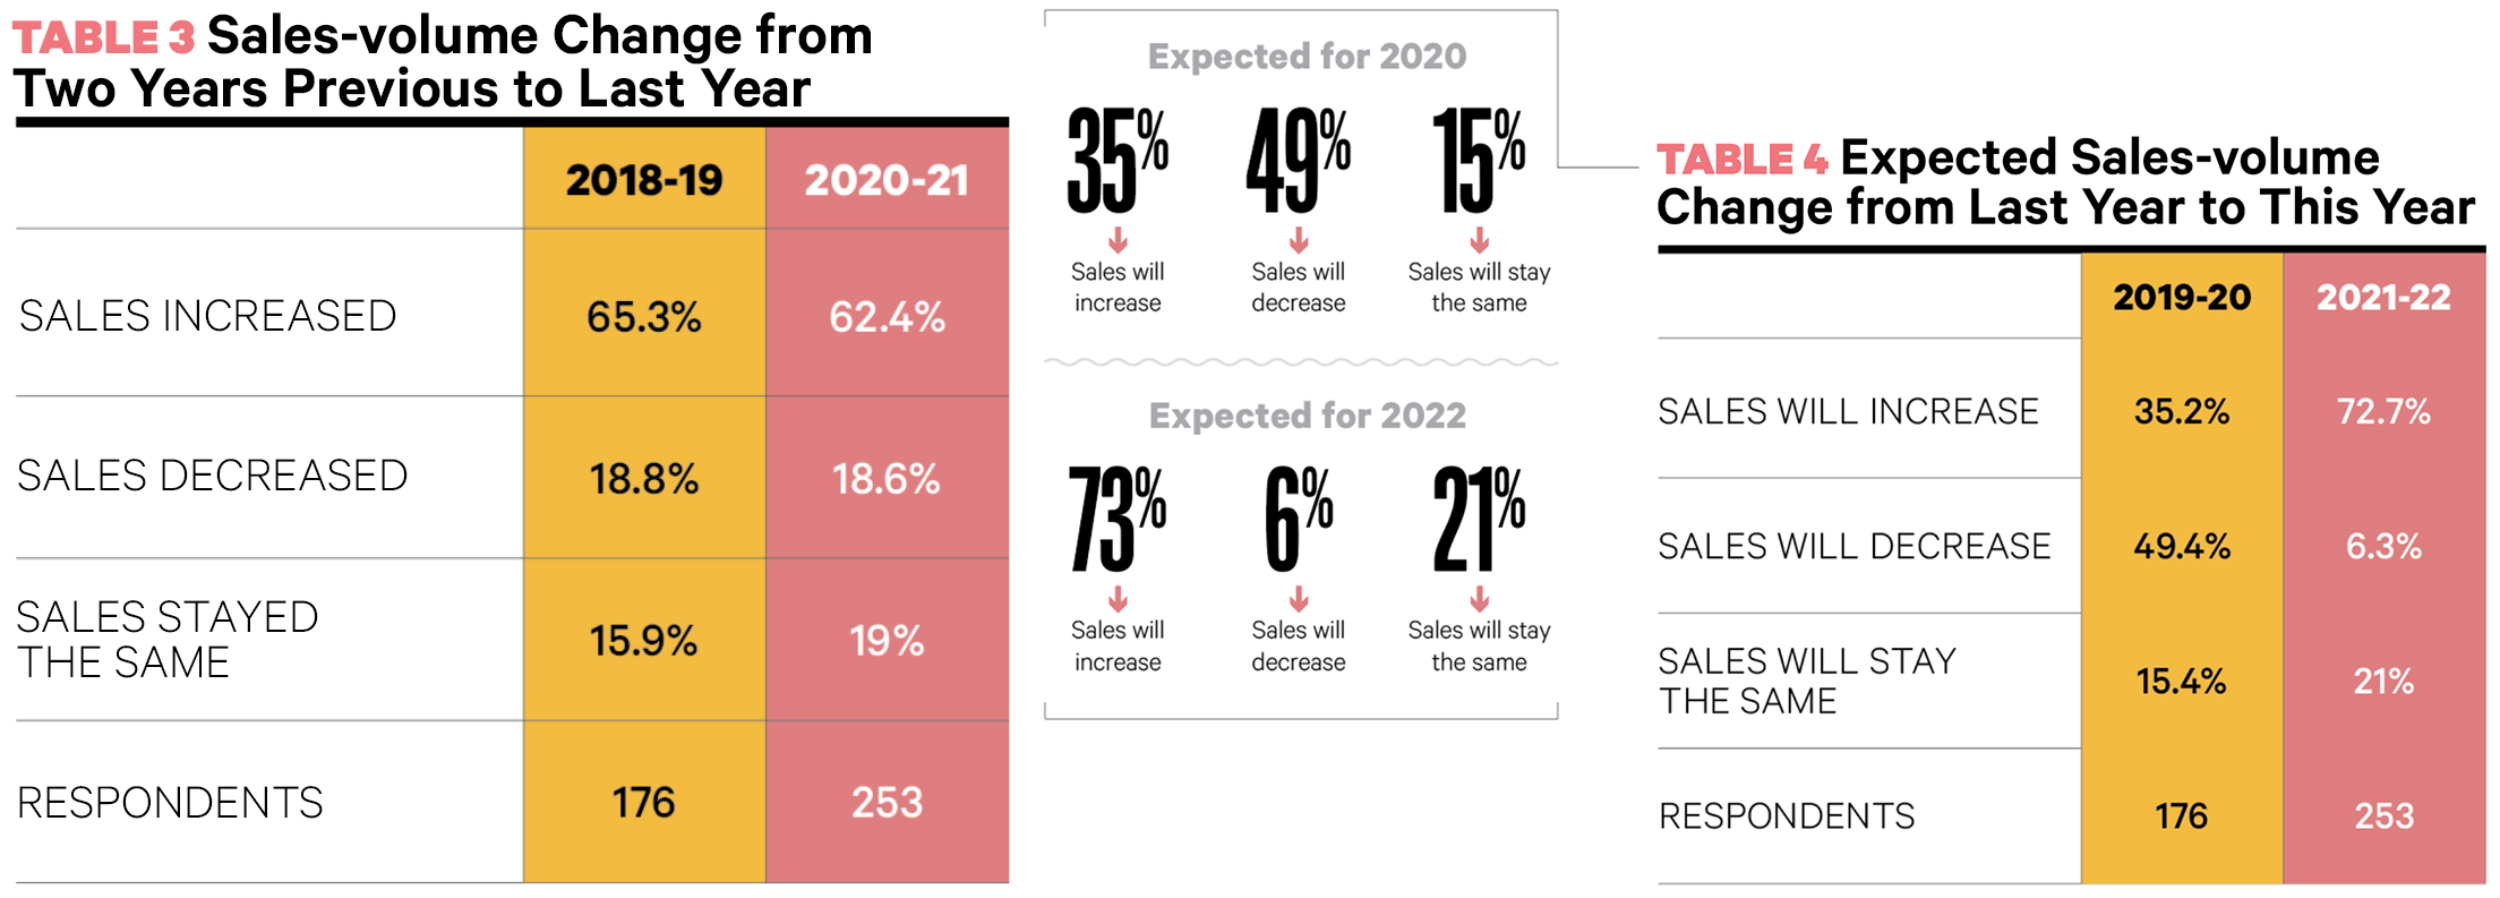
Nearly 63% of the respondents relay their sales volume increased from 2020 to 2021, while sales decreased for just over 18%, with sales for the final 19% remaining about the same. Last time we checked (for 2019 to 2020), those numbers were 65.3% increase, 18.8% decrease and 15.9% the same — all within approximately 3% of this year’s figures (Table 3). However, the changes for expected sales from 2021 to 2022 versus those for 2019 to 2020 (Table 4) could not be more dramatic: 72.7% think their sales will increase in 2022 (compared to 35.2% who expected sales to increase for 2020), only 6.3% anticipate a decrease in sales in 2022 (versus 49.4% — nearly half — for 2020) and 21% foresee sales remaining the same in 2022 (compared to 15.4% for 2020). The companies expecting an increase in sales in 2022 outnumber those contemplating a decrease by a whopping 11.5-to-1 — perhaps signaling a return to the optimism — for the responding companies anyway — that marked the pre-pandemic reports: 9-to-1 (2017), 11-to-1 (2018) and 10-to-1 (2019).
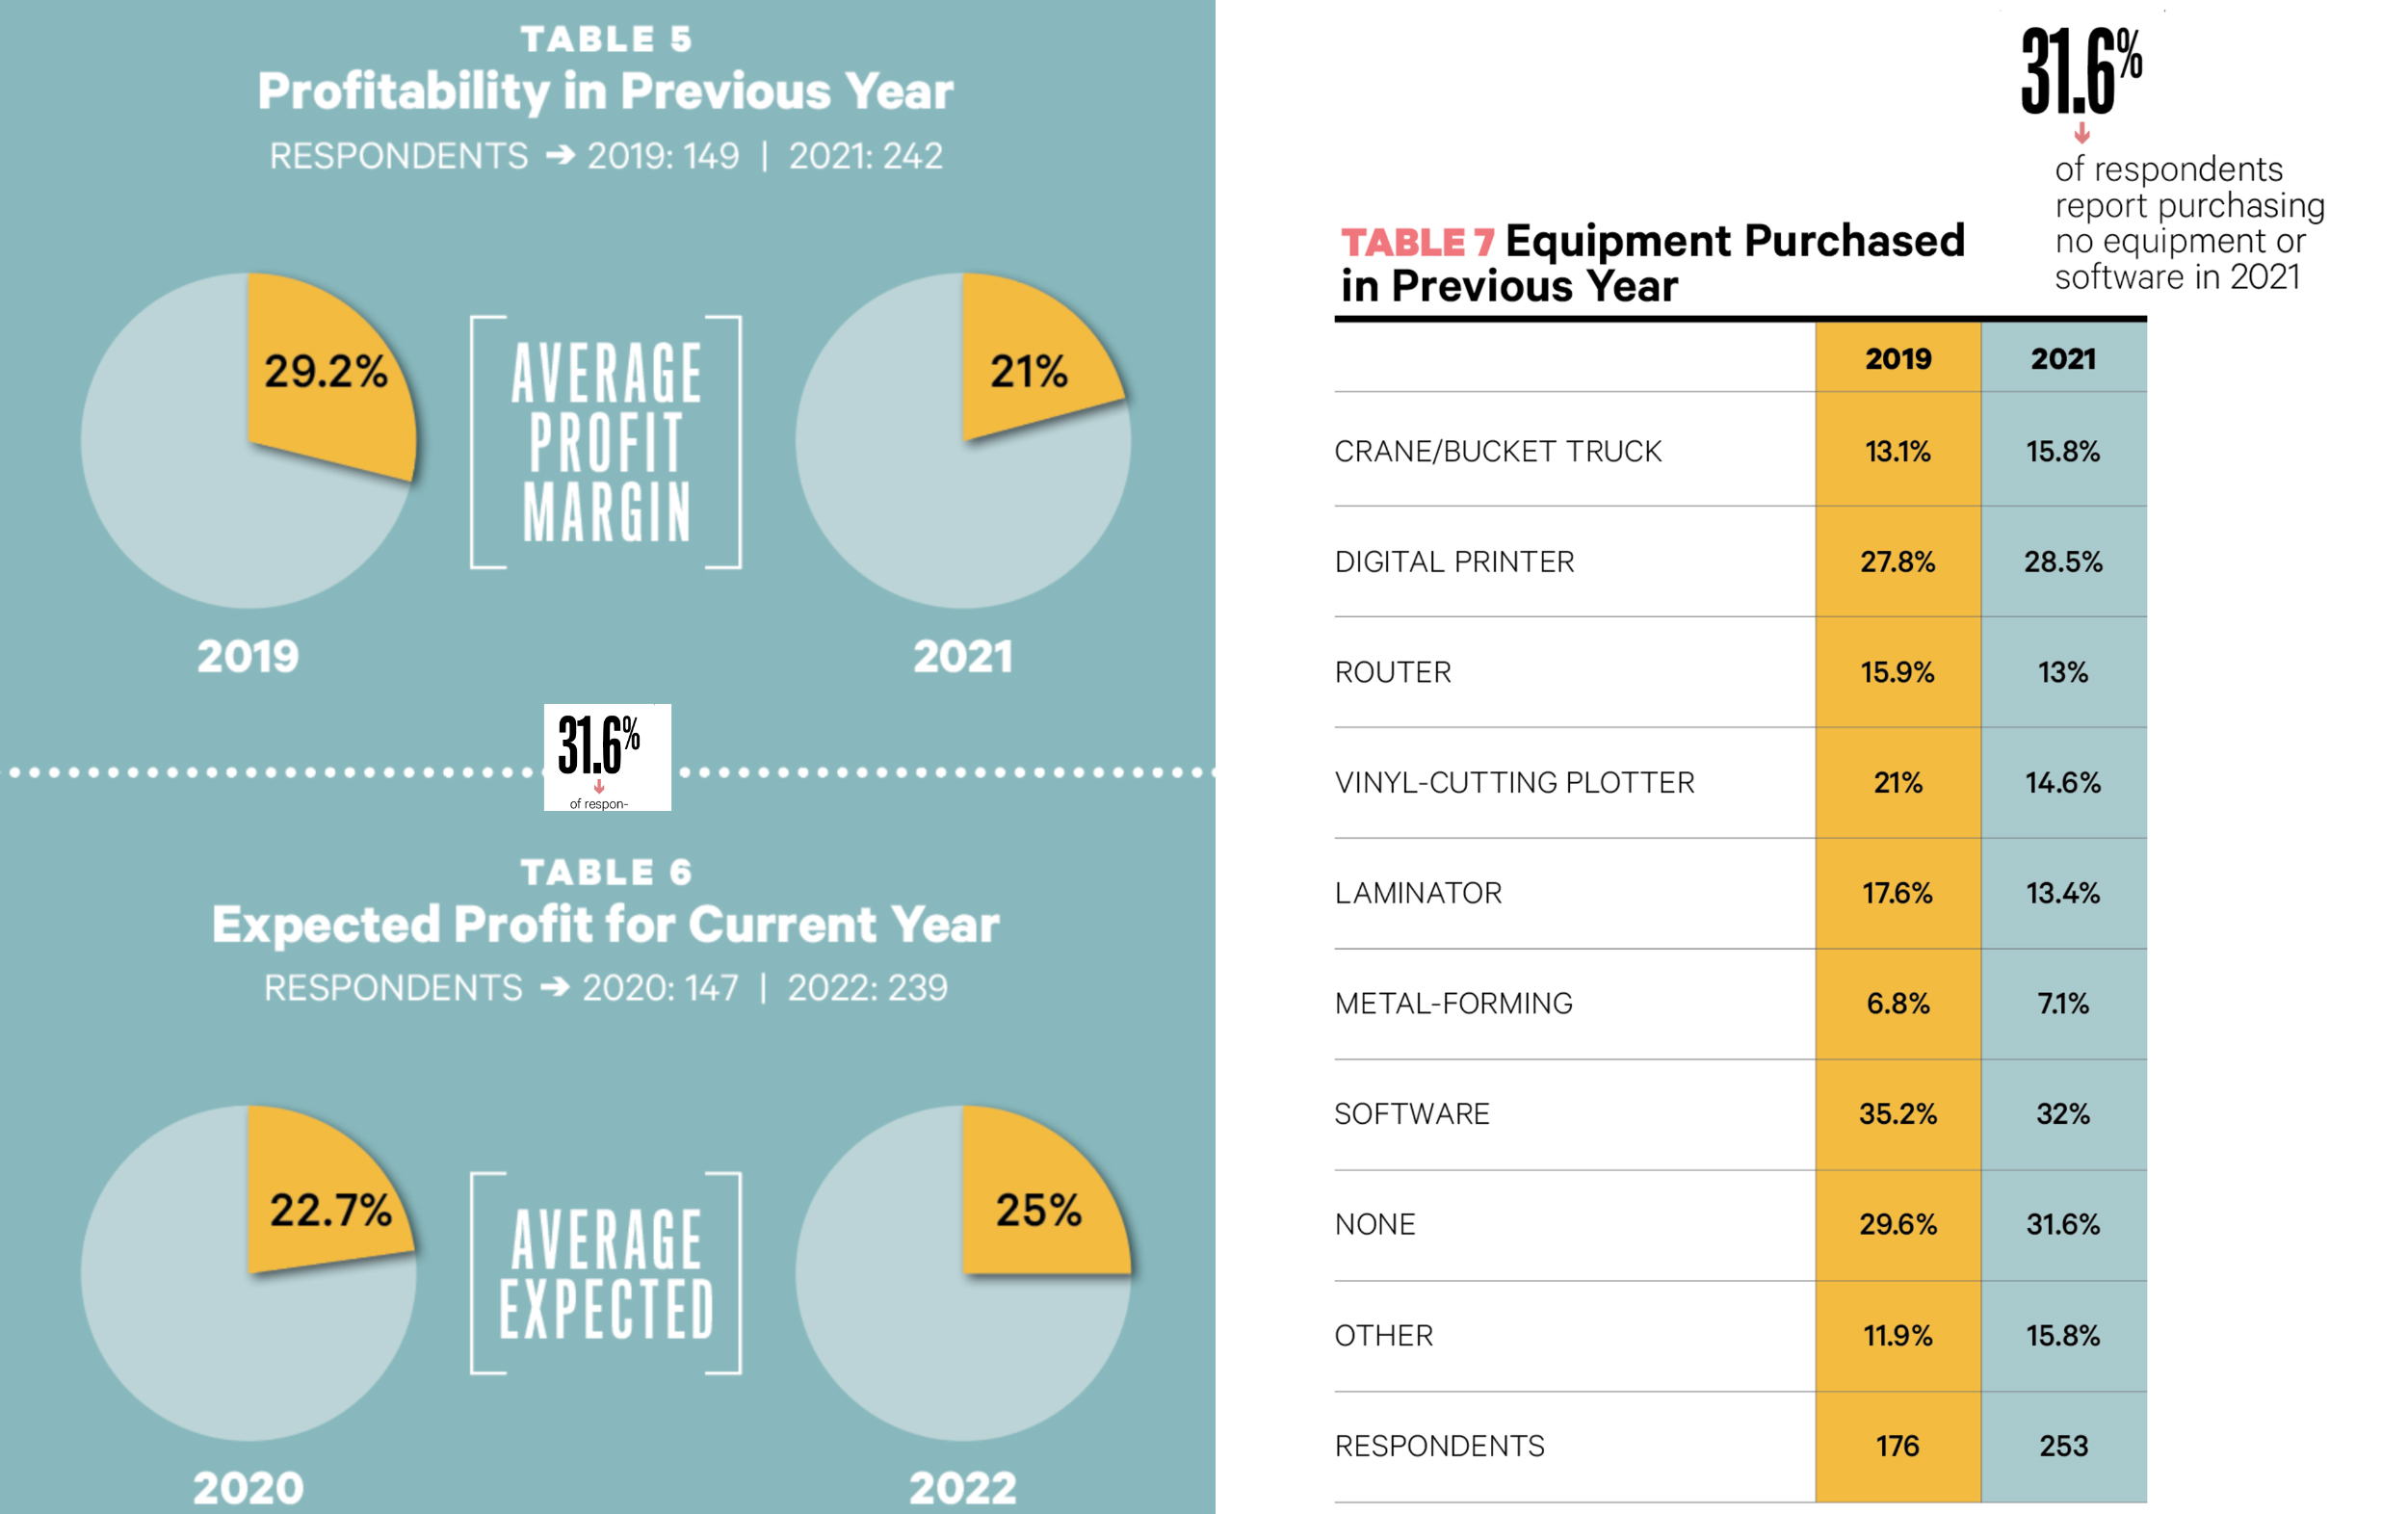
Not surprisingly, profitability for 2021 is reported as being down compared to pre-pandemic 2019, with 242 respondents’ average of 21% for 2021 a fair bit below 2019’s 29.2% (Table 5). Higher prices that many sign companies may have been reluctant or slow to pass along to their customers undoubtedly put a drag on last year’s profit margin. Still, the outlook for 2022’s profit levels mirrors the hopefulness of expected sales increases, with 25% the average anticipated for this year, compared to a less robust figure of 22.7% expected for 2020 (Table 6). We should point out that despite the 25% average for 2022, the median is 20%, meaning a smaller number of companies are expecting higher returns than the majority of respondents. Fully 36.4% of the respondents expect a profit margin of 20% or lower — down from 46% in our previous report — but still a worrying percentage treading that precarious path.
EQUIPMENT
AND INVESTMENT
We fielded 253 responses to our question asking about equipment purchased in 2021 (Table 7). As in the past several surveys, the leading response is software (32%), down slightly from its 2020 figure (35.2%), followed somewhat closely by digital printers (28.5%), up a bit from 2019 (27.8%). Next comes crane/bucket trucks (15.8%, vs. 13.1% in 2019) and vinyl-cutting plotters (14.6% vs. 21% in 2019). In fifth place sits laminators (13.4%) with routers (13%) in sixth, compared to 17.6% and 15.9% two years ago. Metal-forming equipment registers a 7.1% response this year, up a bend from 2019’s 6.8%. It’s interesting that the “other” category attracted 15.8% for 2021, having been 11.9% in both 2019 and 2018. Laser CNC and engraving equipment topped this year’s responses within “other.” We should point out that 31.6% of respondents report purchasing no equipment or software in 2021, up from 29.6% in 2019 and 28% in 2018. This slight drop off could be attributed to the changes to tax advantages to purchasing equipment a few years ago no longer being so new, or more companies wanting to wait for a return of better sales and profitability.
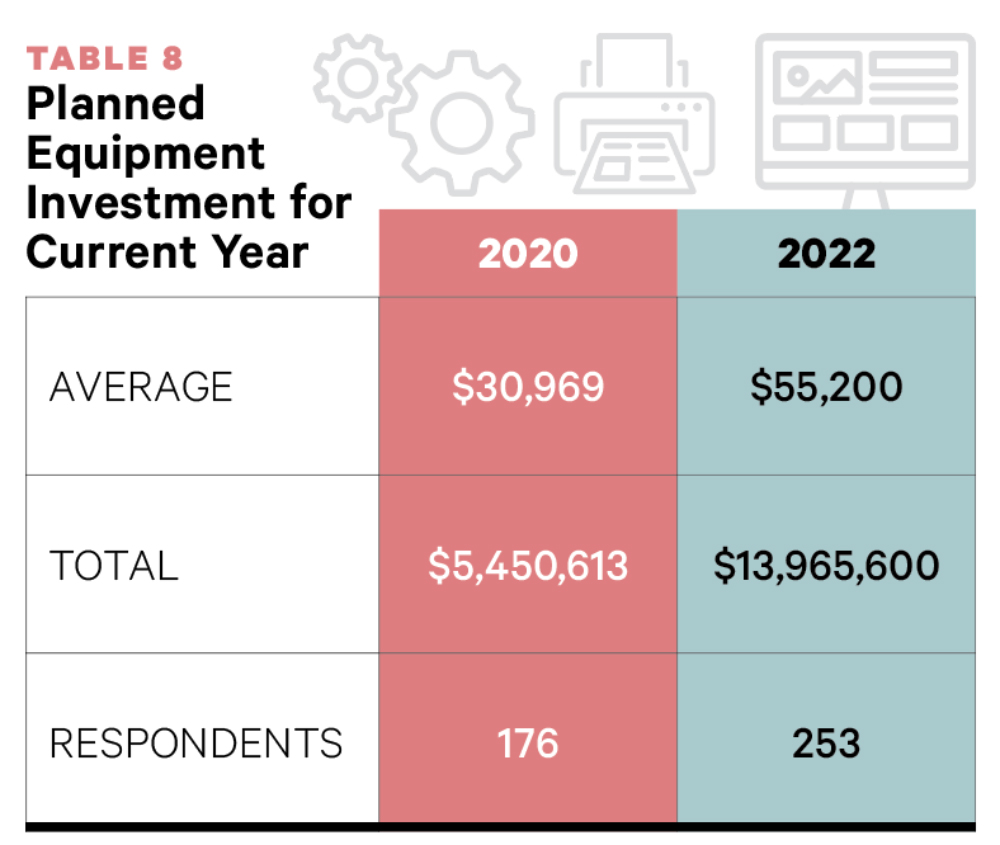
However, those companies we surveyed that are planning to invest in equipment in 2022 are planning to invest much more — an average of $55,200 — compared to 2020’s planned average investment of $30,969 (Table 8). While not to the level of 2019’s average of $71,315, the indication is that the sign companies surveyed here are feeling better about their position to invest. The highest figure we received is $2M while 32% disclose planning to spend nothing on equipment this year, though that figure is down from the 38% reported in 2020.
THREATS TO
THE INDUSTRY
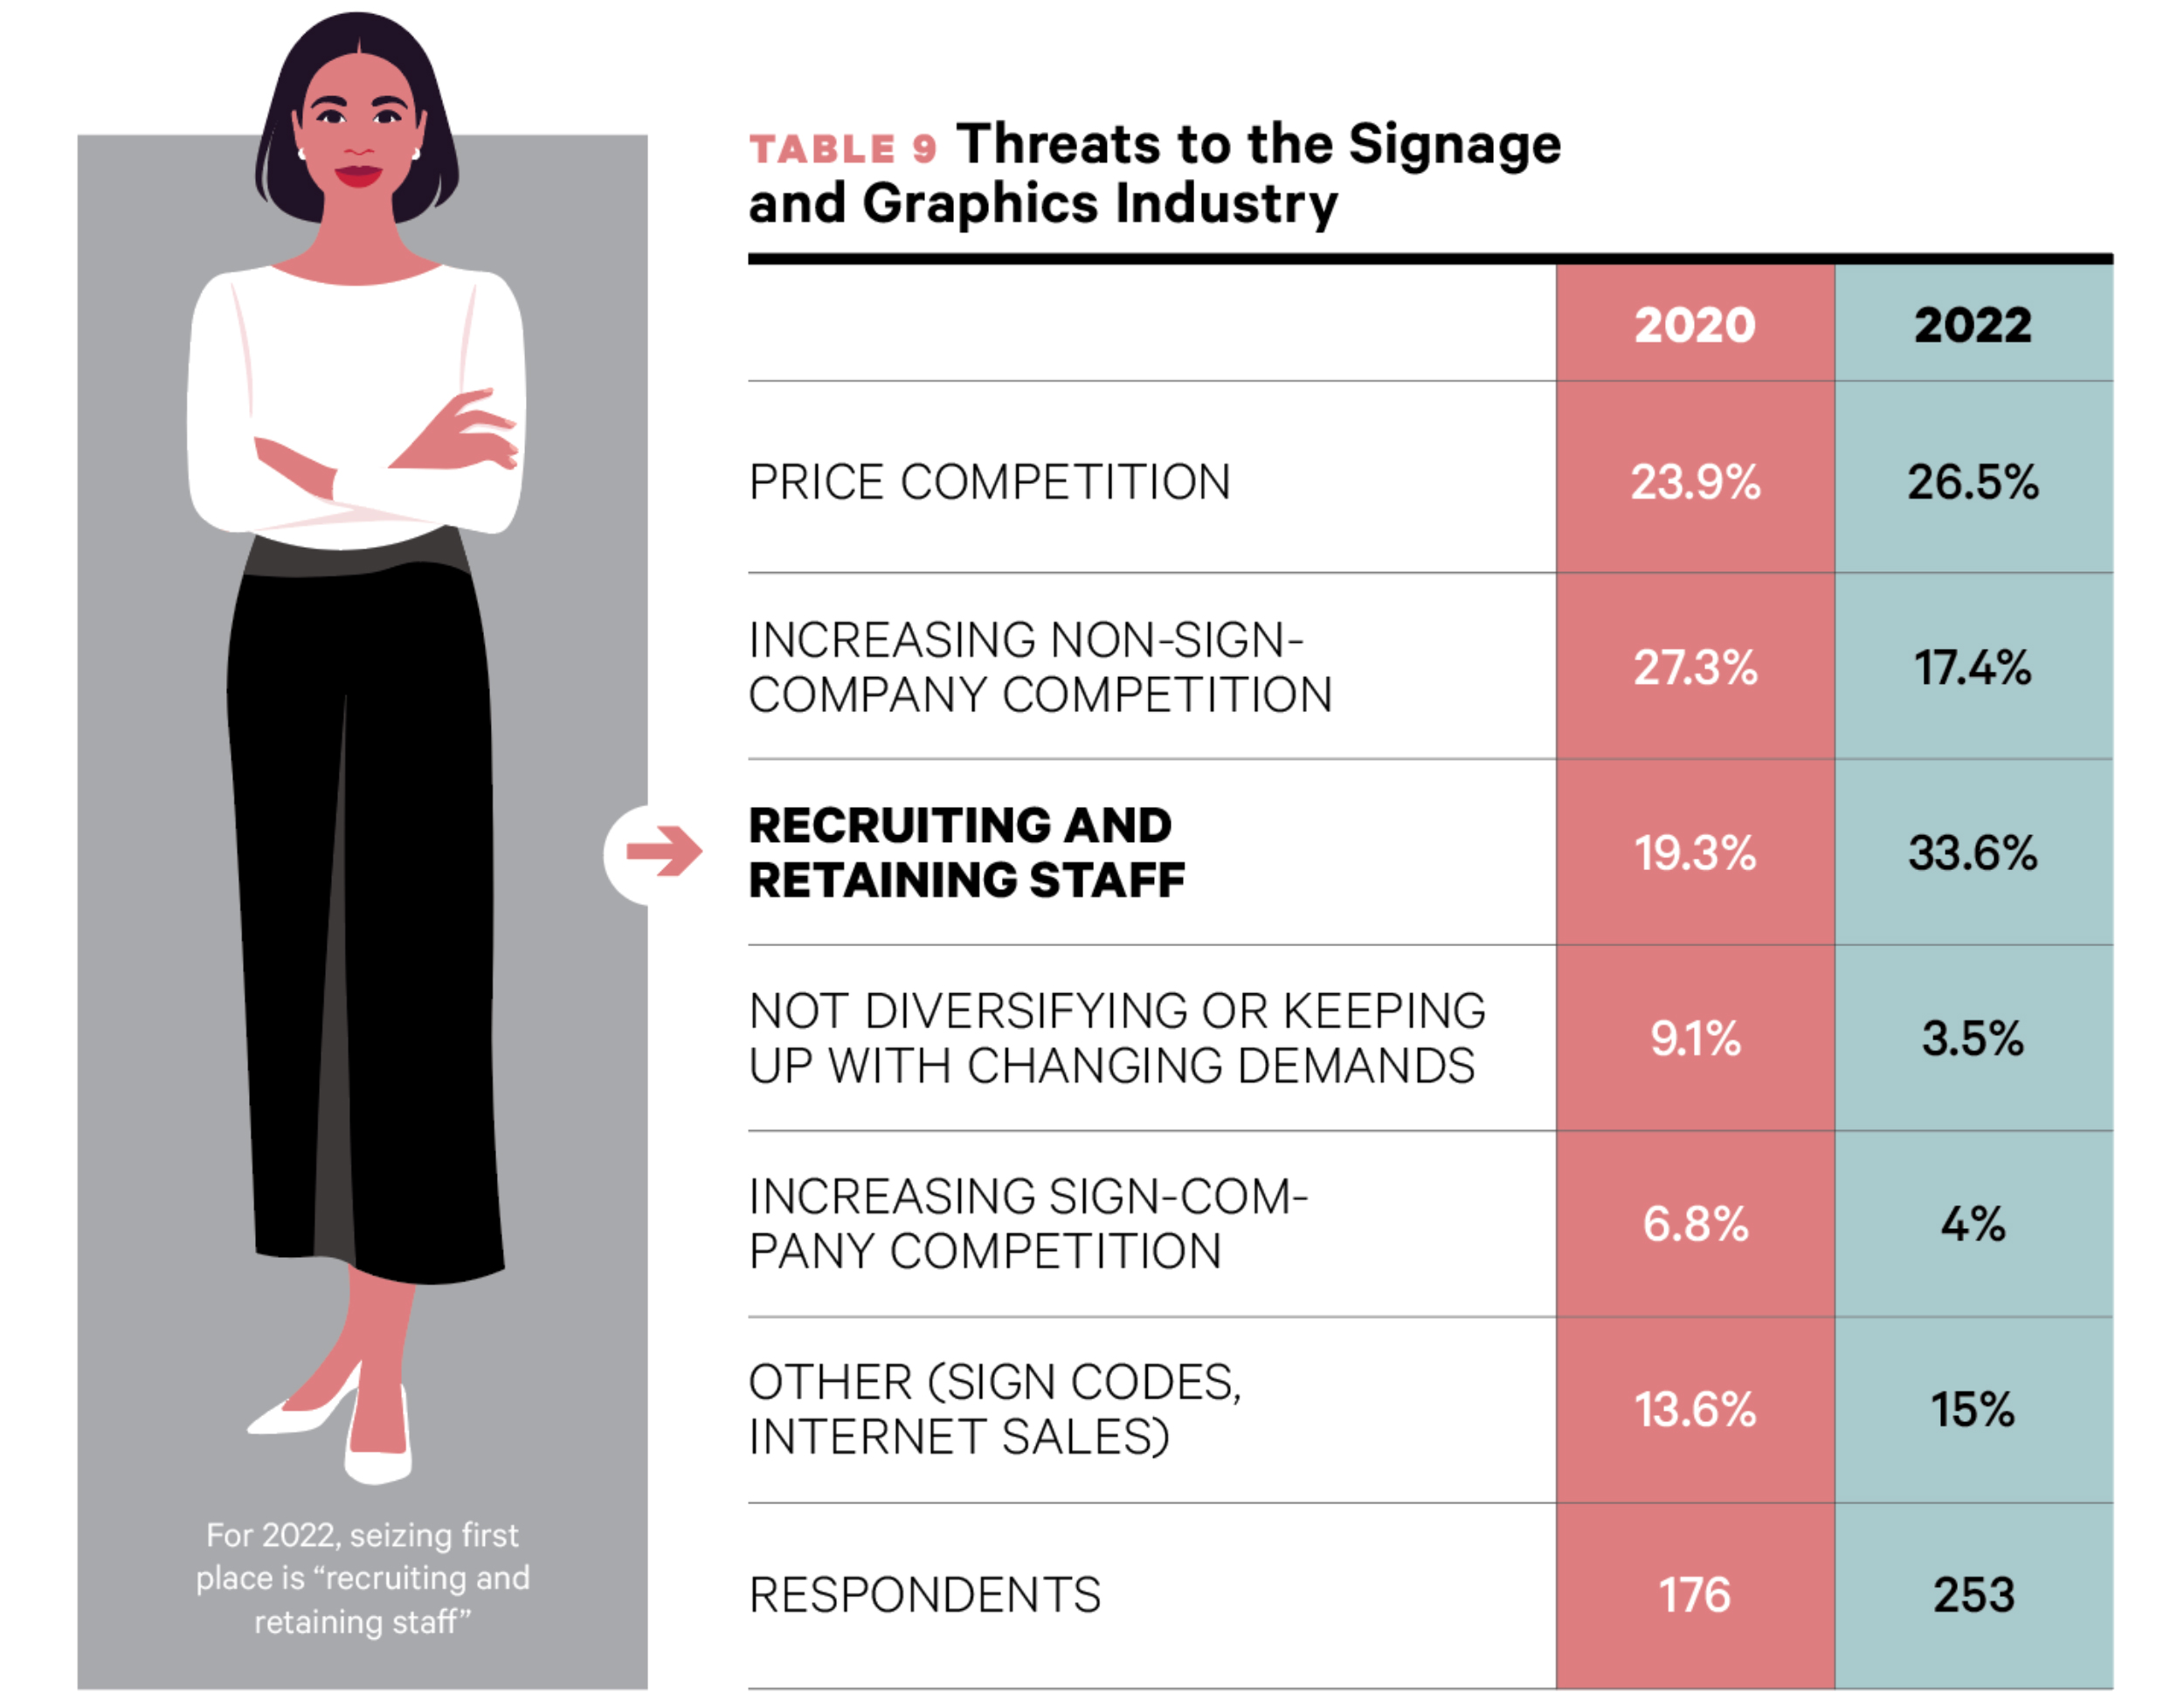
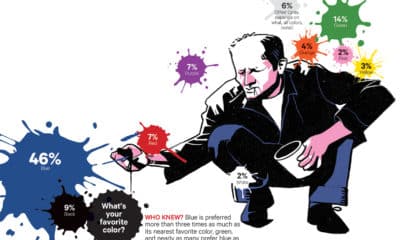
For the fifth time, we included this question: “What do you see as the one, greatest threat to the signage and graphics industry?” (Table 9). For 2022, seizing first place is “recruiting and retaining staff” at 33.6%, up from 19.3% (and third place) in 2020. In second place again, “price competition or diminishing profit margins” registers 26.5%, just above the 23.9% reported for two years ago. Back then, the number one threat was “the increasing number of non-sign companies” at 27.3%, but that worry has plunged to third place for 2022, with 17.4% naming it the top threat. “The increasing number of sign companies in the market” (4%) and “not sufficiently diversifying products/services” (3.5%) arrive in distant fourth and fifth places for 2022, having tallied 6.8% and 9.1% respectively for 2020. “Other” threats received 15% of responses this year, ahead of 13.6% from 2020. Among the reasons specified are the government, the economy, the pandemic and material costs/shortages.
SELLING
ELECTRIC SIGNS
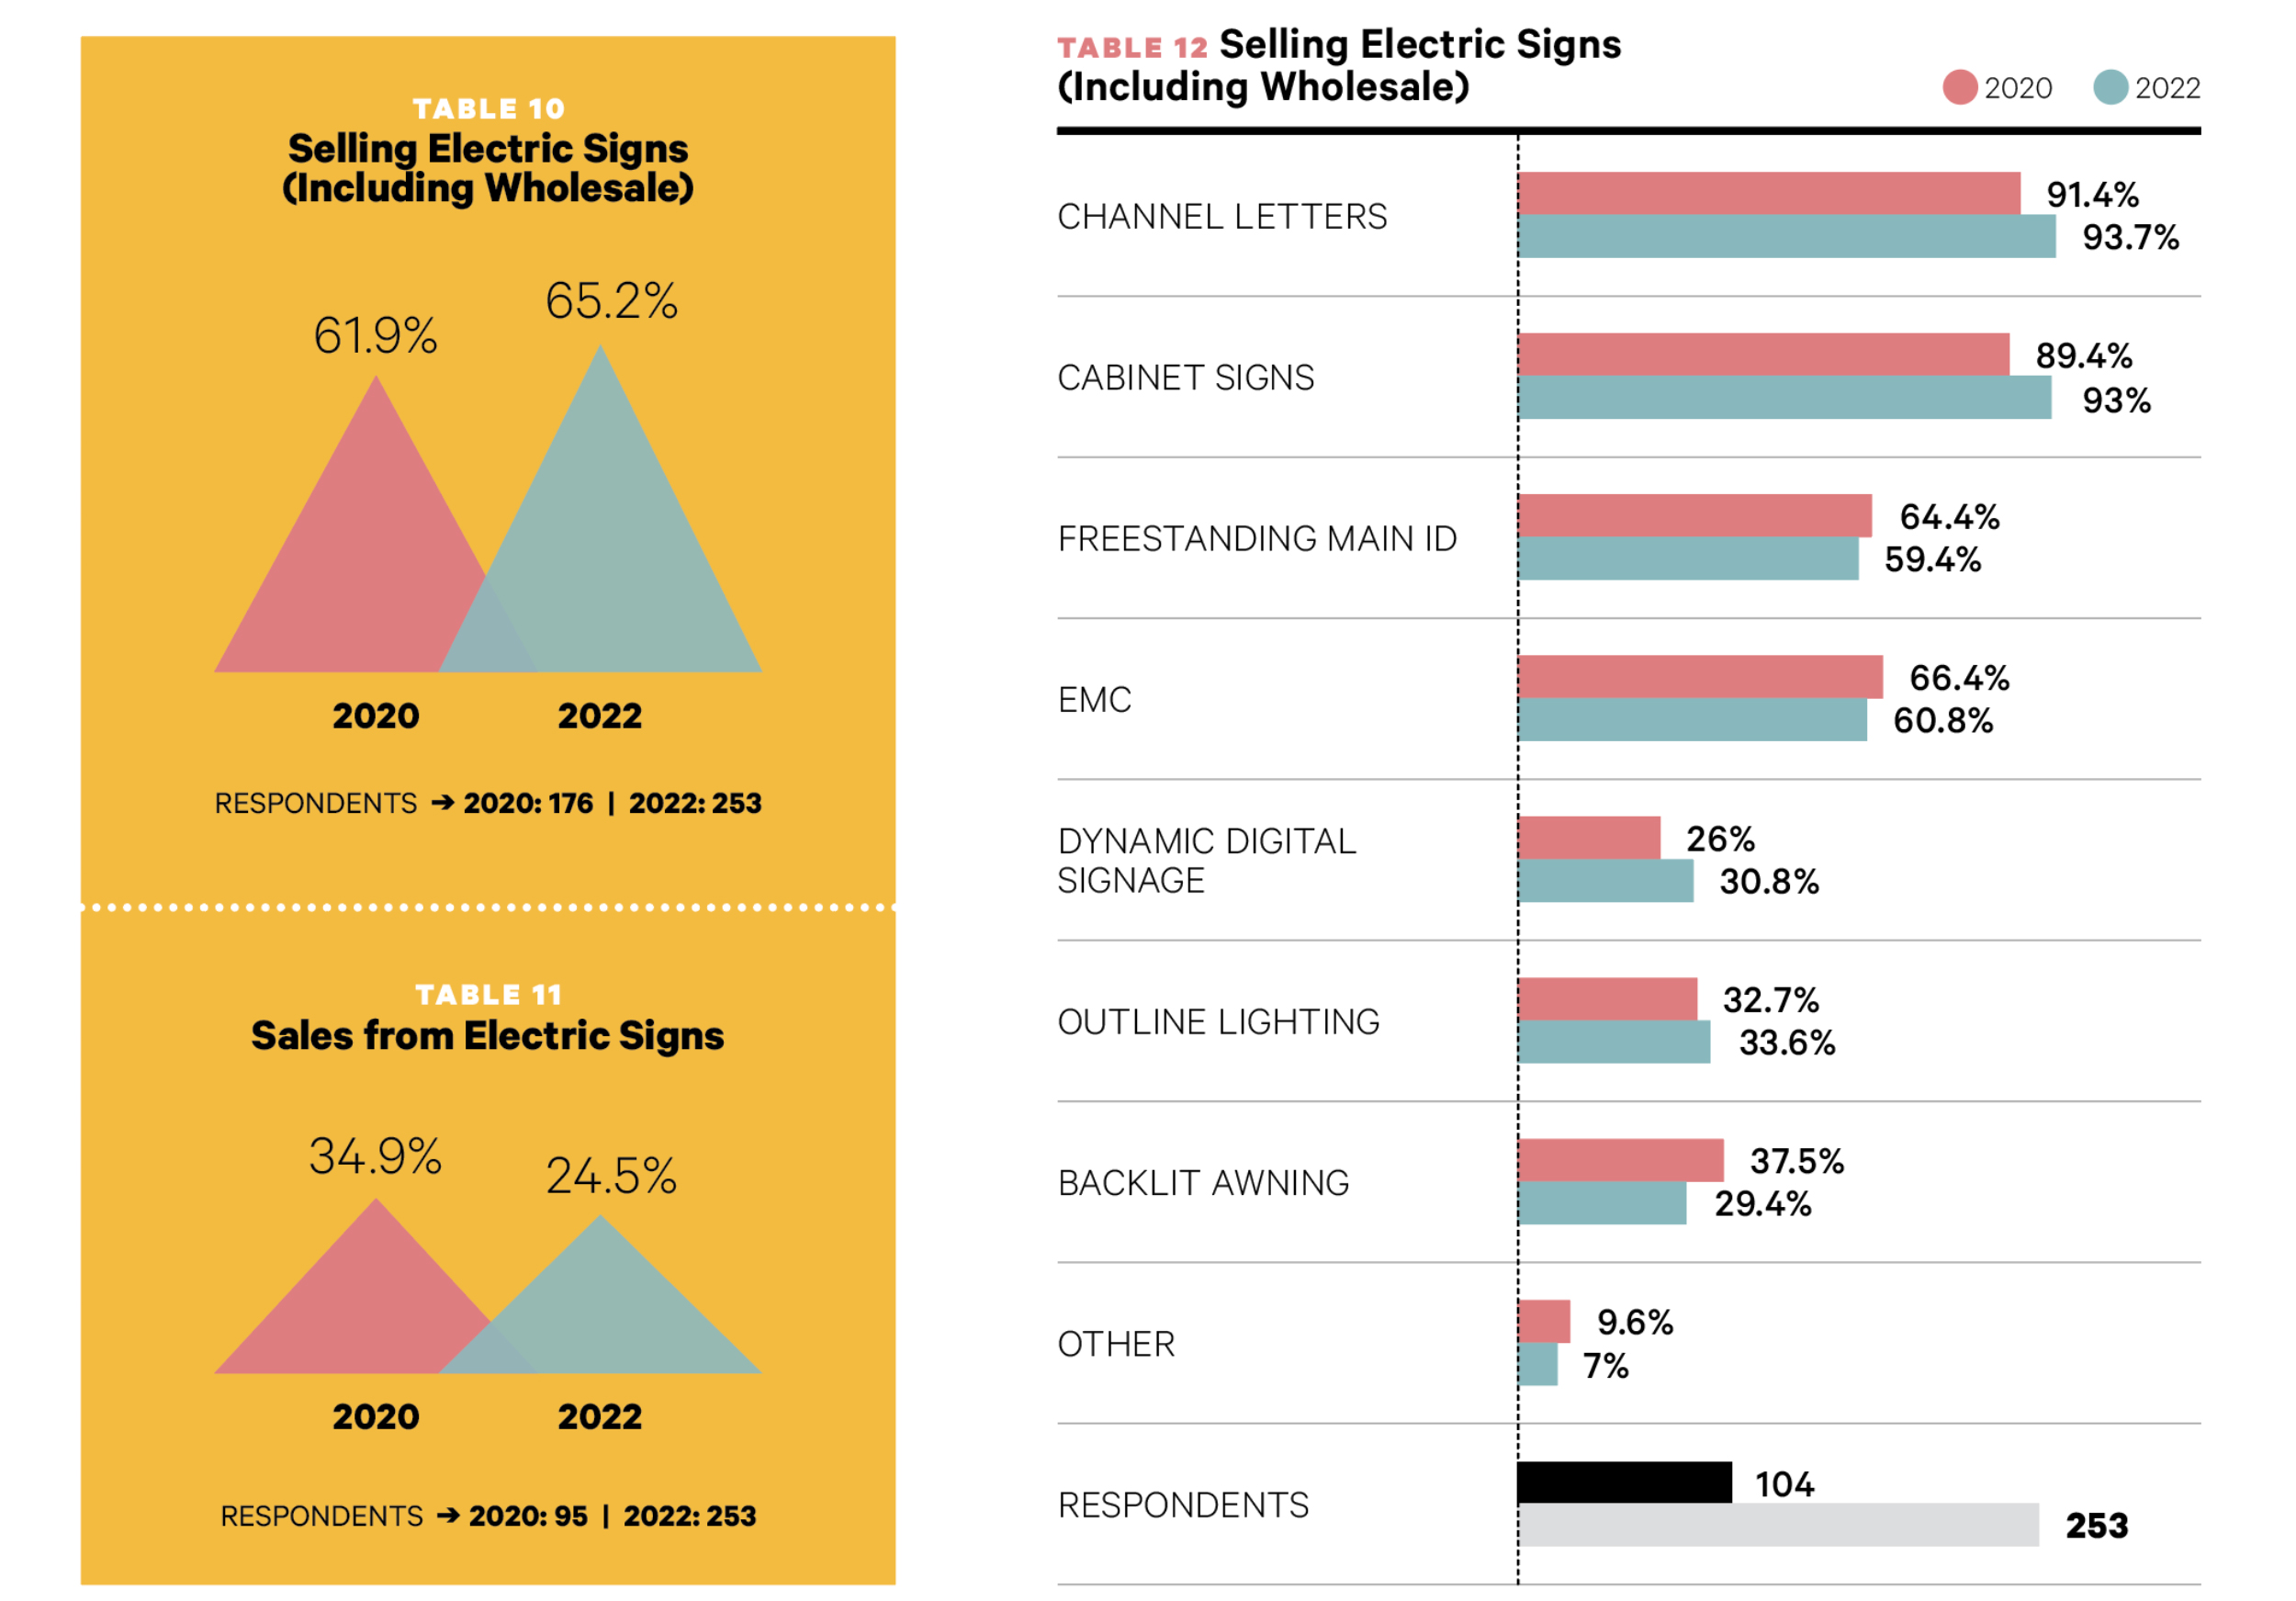
The percentage of companies confirming that they sell electric signs rises slightly for 2022 at 65.2%, up from 61.9% in 2020 (Table 10) and in line with the 65.7% from 2019. It’s encouraging to see that despite the upheaval of the past couple of years and so much signwork being redirected to non-traditional, pandemic-related products and services, the percentage of companies offering electric signs remains quite stable.
As for the percentage of sales derived from electric signs, 24.5% is the figure for 2022, down more than 10% from 34.9% for 2020 (Table 11). One explanation could be that delays for electric projects have taken the wind from those sales for the time being. We at Signs of the Times have been informed anecdotally from several sign companies that this is the case.
ELECTRIC SIGN TYPES
AND ILLUMINATION
Leading the types of electric signs being sold again, as in 2019 and 2020, channel letters are offered by 93.7% of companies selling electric signs, up slightly from 91.4% in 2020 (Table 12), and followed immediately by cabinet signs (93% vs. 89.4% two years ago). Down a touch from our previous report, electronic message centers (EMCs) tally 60.8% compared to 66.4% in 2020. Hot on the heels of EMCs are freestanding main ID signs at 59.4% for 2022, also below 2020’s figure of 64.4%. Next comes outline lighting (33.6% vs. 32.7% for 2020) followed by dynamic digital signage (30.8% compared to 26% two years ago). Backlit awnings merit 29.4% in our current survey, well below 37.5% reported two years ago. The “other” choice stands at 7% this year, with the word “custom” describing most of those, a drop from 9.6% in 2020.
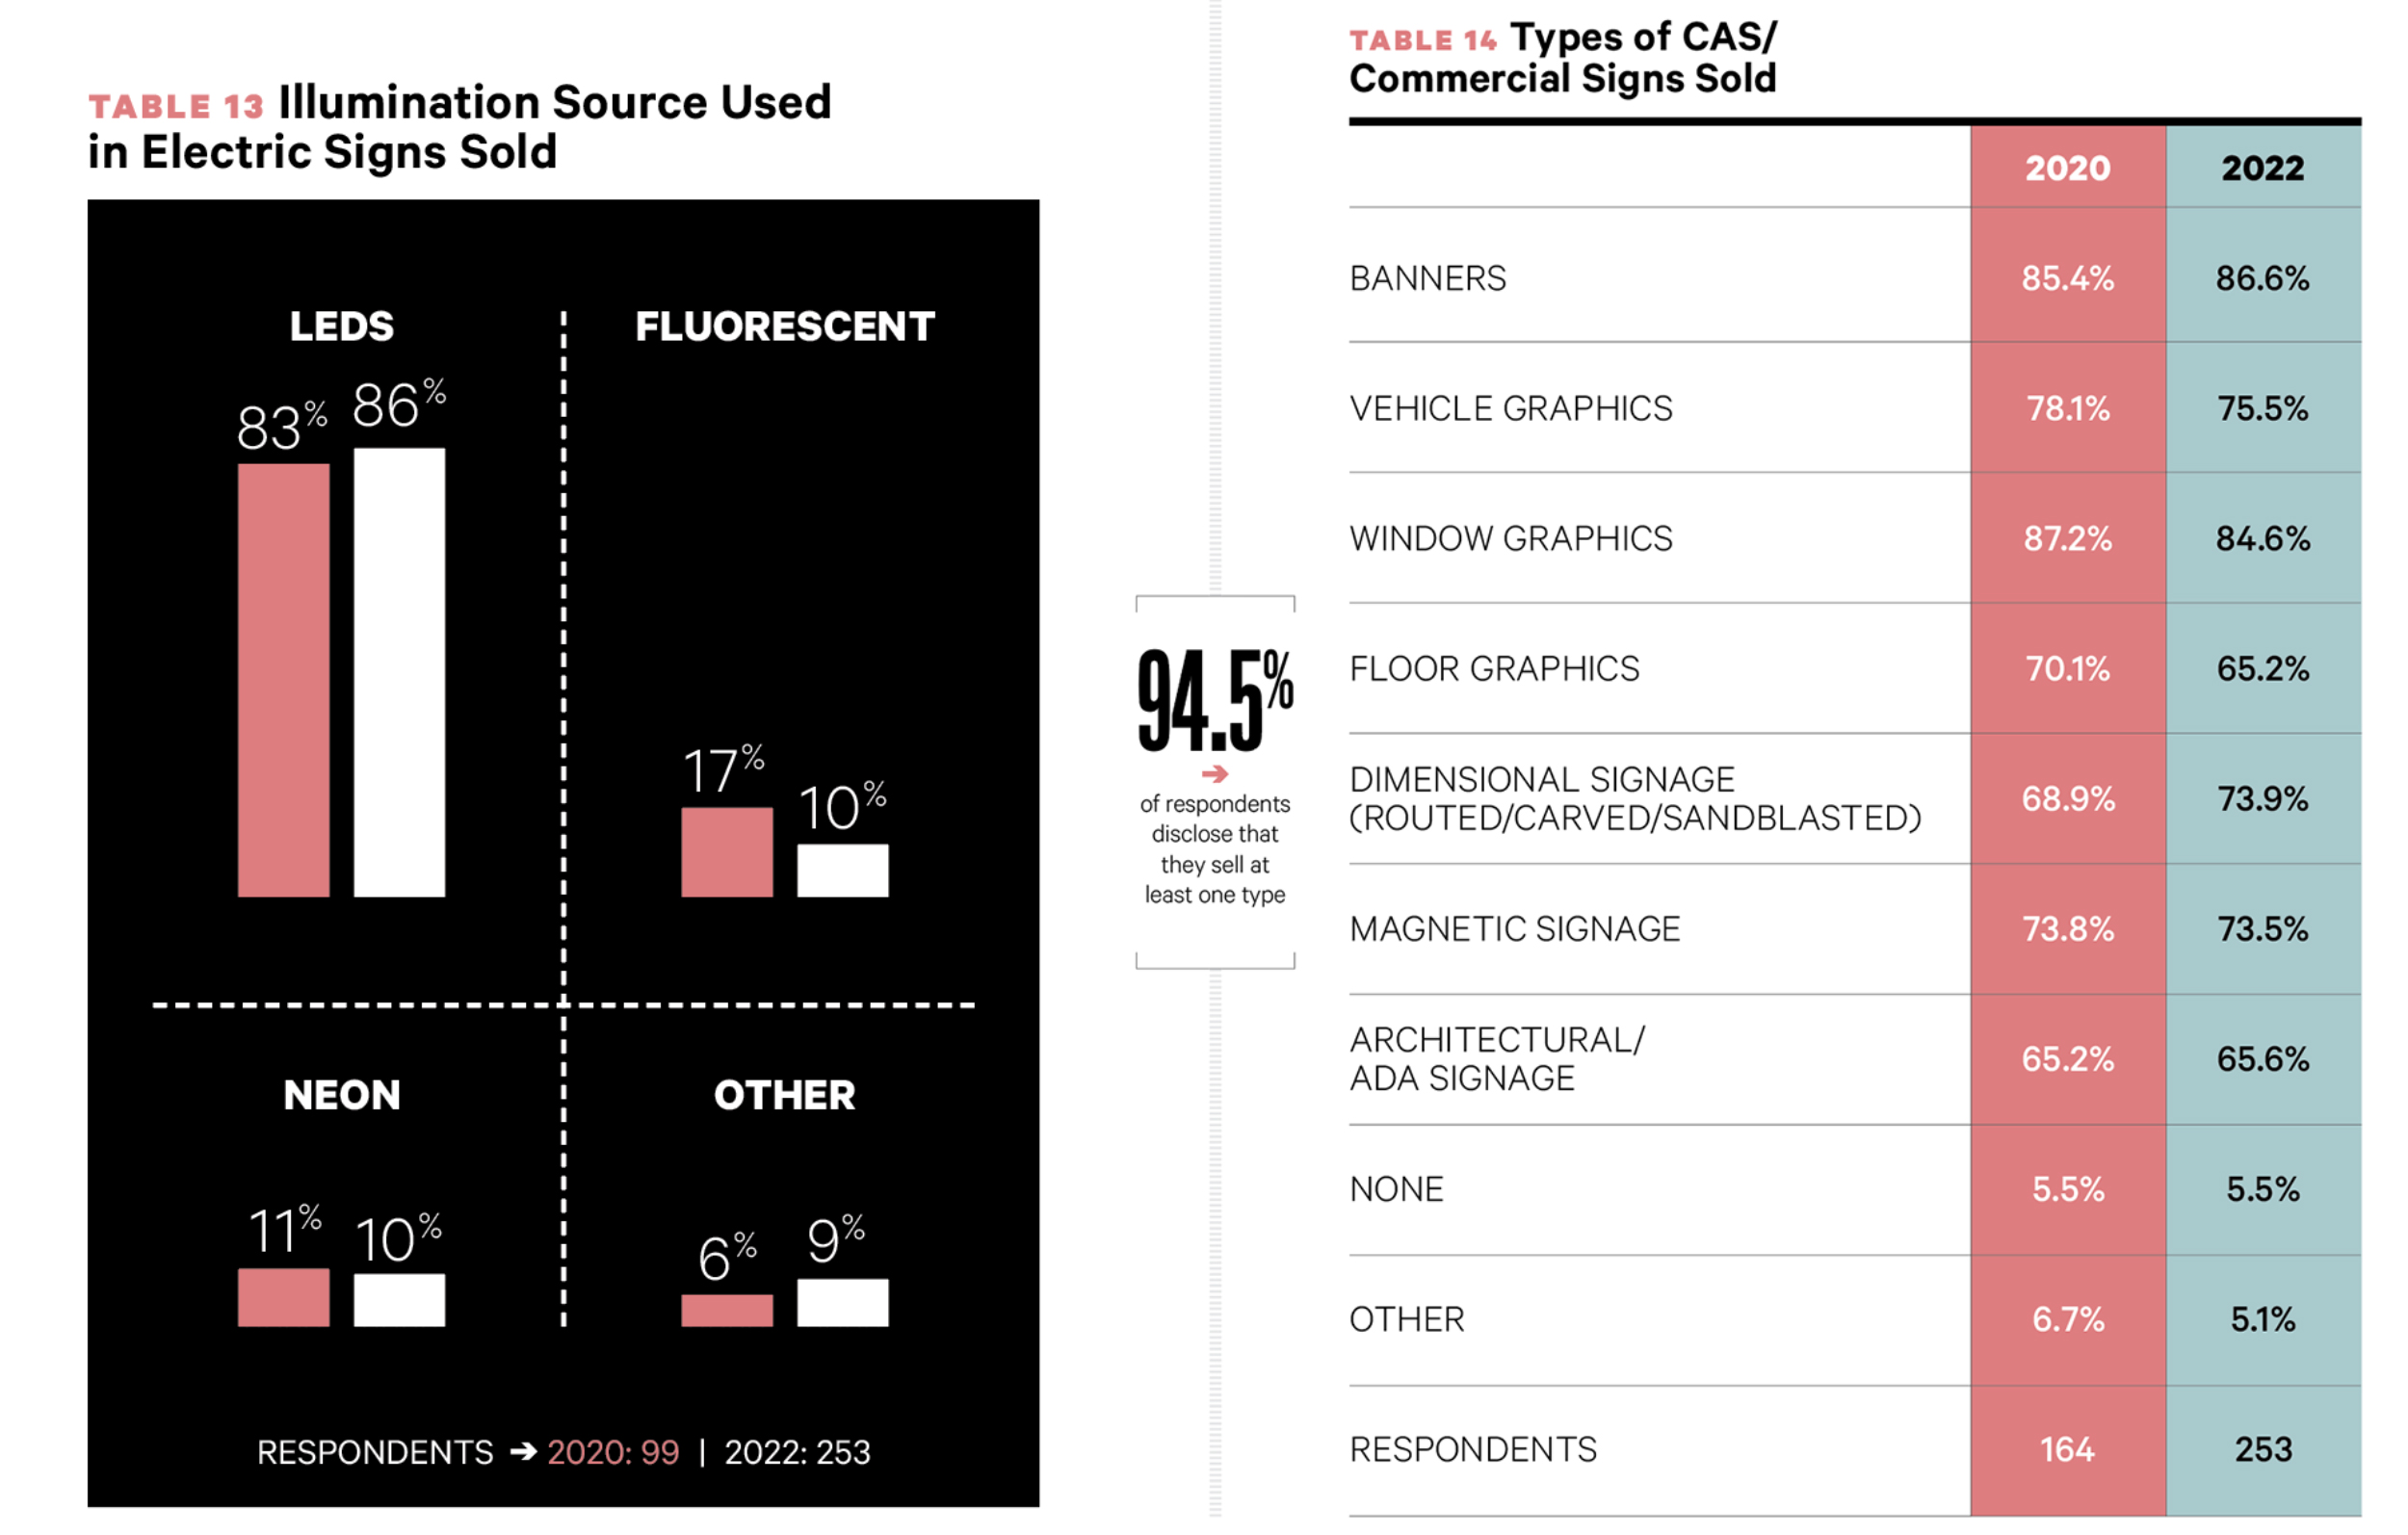
LED illumination unsurprisingly far outstrips its rivals as the choice to light electric signs 86% of the time, up from 83% in 2020 (Table 13) and 85% the year before that. Fluorescent lighting and neon finish in a distant tie for second place at 10% each, compared to 17% and 11% respectively two years ago. “Other” light sources jumps back to 9% this year, matching its 2019 figure and exceeding last survey’s figure of 6%.
CAS/COMMERCIAL
SIGN TYPES/MATERIALS
Of the 253 shops responding to our question asking the types of “CAS/commercial” (to use the longtime Signs of the Times term) signs they sell, 94.5% disclose that they sell at least one type (Table 14). “CAS” here means “computer-aided signmaking” — borrowed from the more common “CAD” — and “commercial” means “not internally illuminated.” The most common type this year is banners (86.6%), up a flap from last survey’s second-place 85.4%. Next for 2022 is window graphics (84.6%), compared to 87.2% in 2020. Vehicle graphics again finishes third with 75.5% this year, vs. 78.1% previously. Dimensional signage moves up to fourth from sixth with 73.9%, ahead of our last report’s 68.9%. Magnetic signage attracts a respectable 73.5% for 2022, essentially even with 2020’s 73.8%. In sixth place this year, architectural/ADA signage stands at 65.6%, also virtually unchanged from last survey’s 65.2%. (Note: ISA’s Quarterly Report predicts, “… architectural signage will cool slightly due to a weakening construction market.”) Floor graphics, at 65.2% for 2022, has understandably stepped back from the 70.1% reported for 2020 as that year’s pandemic-related demand has tapered. Still, it’s interesting to note that all seven specific types of this signage that we named register among just shy of ⅔ of our respondents. A remaining 5.1% (vs. 6.7% last survey) offer “other” among their responses, with wall graphics mentioned most.
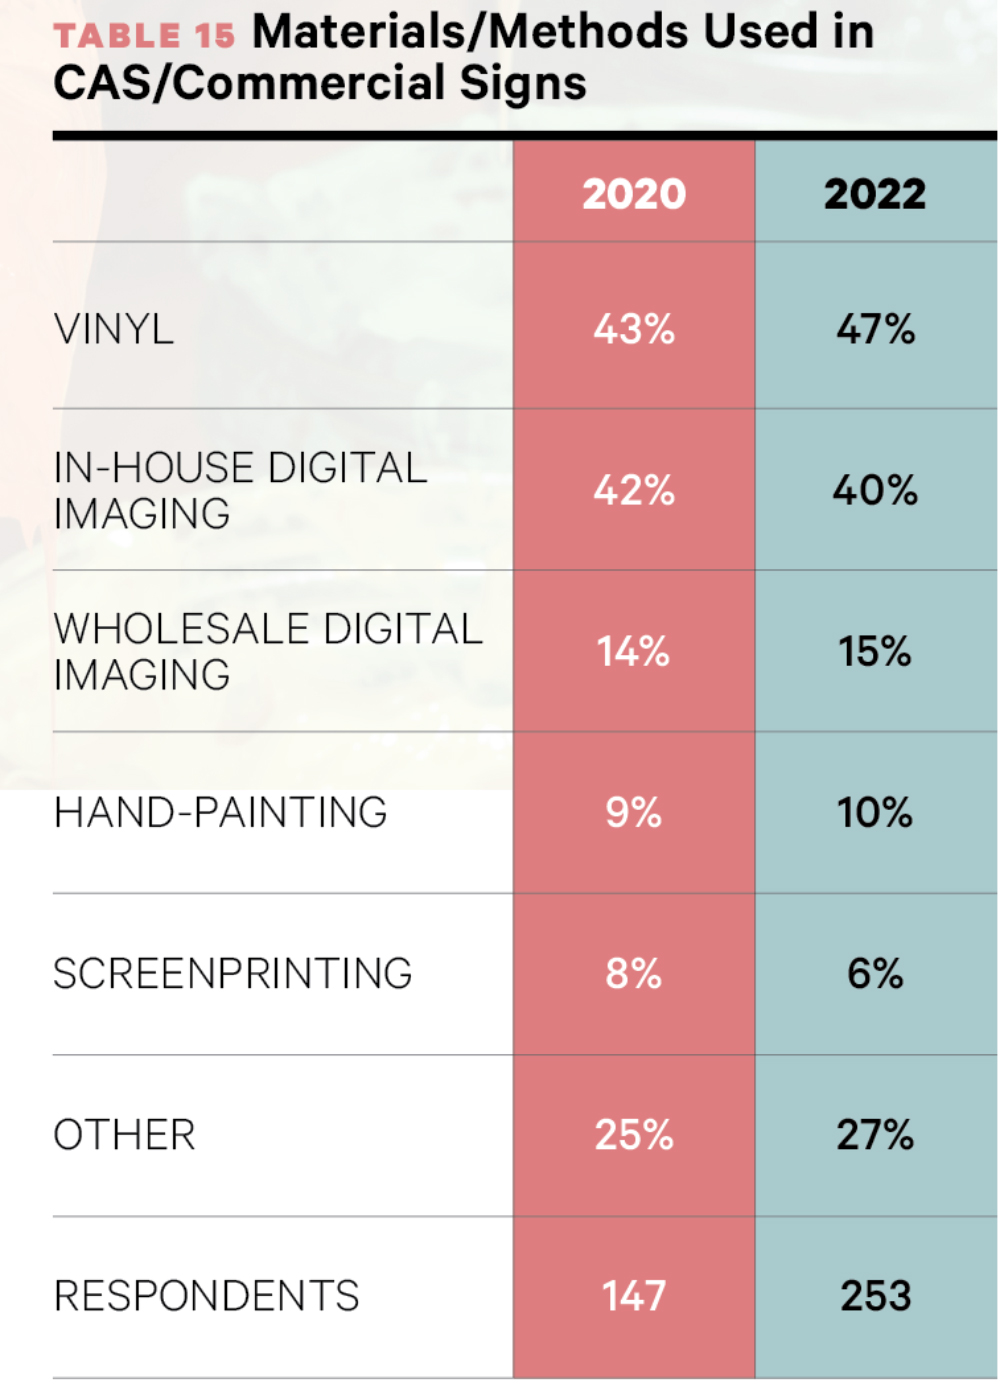
Our final question asked which materials are being used for CAS/commercial signs. Vinyl is the most common at 47% this year, up from 43% in 2020 (Table 15) and just below 48% from 2019. Again in second, in-house digital imaging falls slightly to 40% from last report’s 42%. In third for 2022 with 15% is wholesale digital imaging, one dot above its 14% figure two years ago. Hand painting also brushes up a percent this year (10%) over 2020 (9%), while screenprinting (6%) loses a couple to our previous survey (8%). Here, the “other” choice continues to grow, from 20% in 2019 to 25% in 2020 and now 27%, representing acrylic, HDU, aluminum, wood and other substrates intended for carving, routing, sandblasting or engraving. Could this year’s bump be inspired by material shortages and delays? Or is it just good, old-fashioned ingenuity?
FINAL ANALYSIS
Comparing 2022 with 2020 in terms of sales and profits, equipment, investment and more, the state of the sign industry is unquestionably healthier than the past two years and has proven to be resilient. Having made it through two years of the pandemic, confidence appears high among our respondents for the forthcoming third year in this ‘Age of COVID.’ Companies expecting their 2022 sales to increase over the previous year outnumber those expecting a decrease by nearly twelve-fold — back to 2019’s and earlier figures. Average profits are anticipated to rise by a quarter from 2020’s reported 20% to 25% this year. The average dollar amount being prepared for equipment investment for 2022 is nearly double the average found for 2020 and the number of companies planning no investment is decreasing this year as well.
The rise in “threat level” of recruiting and retaining staff to that of prime concern certainly represents a problem for sign companies. But another way to look at it, especially in combination with this full report, is that difficulty in recruiting and retaining staff is a problem that indicates there’s much work to do and the state of the sign industry is indeed strong.
Introducing the Sign Industry Podcast
The Sign Industry Podcast is a platform for every sign person out there — from the old-timers who bent neon and hand-lettered boats to those venturing into new technologies — we want to get their stories out for everyone to hear. Come join us and listen to stories, learn tricks or techniques, and get insights of what’s to come. We are the world’s second oldest profession. The folks who started the world’s oldest profession needed a sign.


American Sign Museum Names New Executive Director

3 Things Print Pros Must Do to Build Stronger Relationships in the Interiors Market

Graphics Turn an Eyesore Cooler Into a Showpiece Promo in Historic Plaza


Bulletins
Get the most important news and business ideas from Signs of the Times magazine's news bulletin.
-

 Tip Sheet1 week ago
Always Brand Yourself and Wear Fewer Hats — Two of April’s Sign Tips
-
 Photo Gallery2 days ago
30 Snapshots of the 2024 ISA Sign Expo
-

 Ask Signs of the Times4 days ago
Why Are Signs from Canva so Overloaded and Similar?
-

 Real Deal1 week ago
A Woman Sign Company Owner Confronts a Sexist Wholesaler
-
 Benchmarks6 days ago
6 Sports Venue Signs Deserving a Standing Ovation
-

 Editor's Note2 weeks ago
Why We Still Need the Women in Signs Award
-

 Women in Signs1 week ago
2024 Women in Signs: Megan Bradley
-

 Photo Gallery1 week ago
21 Larry Albright Plasma Globes, Crackle Tubes and More