Business Management
Data-Driven Digital Menu Boards
Data-driven, dynamic-digital signage (DS) surrounds us; from transportation, departure-arrival displays to touchscreen, hotel-lobby displays, and much more. In restaurants and foodservice venues however, data-driven displays are rarely leveraged apart from drive-through or point-of-sale (POS), order-confirmation screens. But for digital menuboards (DMB), the overwhelming majority of displays feature digital versions of printed menus, perhaps with an animation or two thrown in. Why hasn’t this seemingly obvious and important point of guest interface and purchase decision been part of the data-driven content model? The most common, and in many cases, correct, response is the lack of proof (data analytics) that DMBs drive revenue. Let’s start with two logical assumptions:
- DMBs should be a critical point of information, influence decision-making, and generate increased sales in many food and beverage environments.
- To prove they can deliver predictable ROI, DMBs must be tested in a disciplined manner that exclusively determines the cause and effect of the DMB content by eliminating all other influencing factors.
If the first assumption is valid, DMBs represent perhaps the single-most important opportunity to inform and influence guest decision-making, improve guest experience, lift revenue, and continually gain insights on guest behavior.
To prove the second assumption is valid, simply consider the menu-testing process every culinary organization employs: thoroughly test ingredients and recipes in order to validate inclusion on the menu. From cuttings and blind tastings to operational and consumer trials, testing is a critical component for success. Given this, why not employ the same type of discipline to ensure DMBs are optimized to drive maximum results?
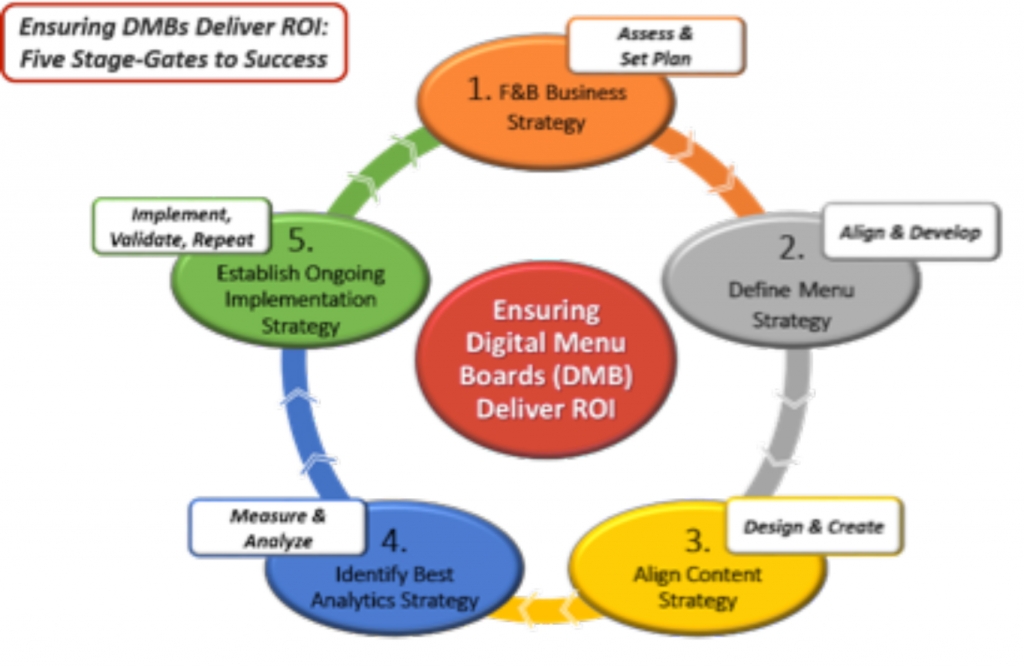
 The Data-Driven DMB is a descriptor that represents the concept that data and analysis (data analytics) are being used to influence all decisions surrounding the initial and ongoing content strategy and how it is presented on the menu provided by the culinary organization. This process can be done periodically with data in batches or supplied in real-time, but, regardless, it should be a disciplined organizational effort.
This capability exists and is the heart of the new breed of menu strategy using DMB optimization, analytics and data-driven design. Any food and beverage organization considering implementing DMBs will examine ROI. Thus, the decision to invest in DMBs can be based on a strategic, three-point organizational strategy to a) drive results, b) harvest critical guest insights and c) deliver untapped value. Better yet would be if this strategy provided predictable returns on both CapEx and annual OpEx investment, all while improving guest experience, competitive brand differentiation, and the bottom line. Here s a real-world example.
AMC Theatres: Applying Predictive Analytics to POS Transaction Data
AdvertisementApproximately five years ago, AMC Theatres began deploying DMBs in a few dozen theatre sites. Efforts to quantify and qualify performance began, but after three years, definitive results and ROI proved inconclusive. Consequently, in late 2013, AMC Theatres engaged the Predictive Analytics Team at Allure Global Solutions to develop an analytics testing model to determine if data-driven DMBs would outperform traditional DMBs and printed menuboards.
Business and menu strategies were provided to develop the testing, data-gathering and analysis model. Six test sites were carefully selected to feature new optimized DMBs; (see the “before” and “after” illustrations) this optimized DMB design for the test sites was evaluated through two test phases, with any changes based on Phase 1 analysis being implemented in Phase 2. The results were compared to a control group of print-menu sites, and to a control group of previously deployed DMB sites; both featured identical content designs, although the previously deployed DMB sites also featured existing animated content.
Key objectives of this analytics test:
- Definitively determine whether optimized, data-driven DMBs outperformed the other two groups in:
- Average transaction value
- Targeted menu-item sales
- Per cap (per capita) spending
- Determine if resulting performance could be reliably predicted if scaled to the enterprise.
- Determine reliable performance forecasts based on the smallest number of sites and investment.


The following results were achieved:
Advertisement- The identified Key Performance Indicators (KPI) of average transactions, per-cap spending, and targeted item sales all measurably increased and were definitively attributable to the data-driven, optimization strategy tested.
- Spending increased in the DMB test sites in both average price and the number of transactions. All food categories experienced growth, but targeted menu items also experienced sales increases ranging from single-digit percentages to nearly 100% growth in sales for certain items.
- Projections based on normalized performance to the entire circuit well-surpassed $10 million in annual impact.
- Test target results were exceeded by 210%.
These analytics test efforts led to approval for rolling out of the optimized, data-driven DMBs, with deployment to date surpassing 80% of all sites. According to Tonya Mangels, VP, Food & Beverage Marketing, AMC Theatres, “The predictive-analytics testing process opened our eyes to the importance and value of data-driven DMBs. As a result, we have green-lighted deployment to our entire circuit and have continued by implementing ongoing annual testing and analysis to maximize revenue performance every year.”
Author George Yunis will be a panelist on the Digital Signage Federation’s October “Hangout” discussion entitled, “Tried & True Practices in Digital Menu Board Signage,” on October 14 at 2 pm EDT. More information on this and other DSF events can be found on the DSF website. Both DSF members and non-members may join this or any of the DSF’s scheduled Hangout conversations for free – but registration is required and can be accessed on the “Events Page” of the DSF website at http://digitalsignagefederation.org/event-2025310
In his role as Senior VP, Marketing & Client Strategies at Allure Global Solutions, and in prior roles with Aramark and advertising/marketing firms, George Yunis has been responsible for brand-to-consumer engagement and content-solution strategies, with specific focus on the convergence between place-based media and connected consumers digital behavior and technologies. Passionate about helping clients develop strategies to accelerate channel, campaign and brand execution and objectives, Yunis has long been involved in digital-signage-industry education as one of a select group of distinguished faculty members for DSE, and through speaking at IAVM and other events. He is also a former board member and co-chair of the Digital Signage Federation s Education Committee.
Introducing the Sign Industry Podcast
The Sign Industry Podcast is a platform for every sign person out there — from the old-timers who bent neon and hand-lettered boats to those venturing into new technologies — we want to get their stories out for everyone to hear. Come join us and listen to stories, learn tricks or techniques, and get insights of what’s to come. We are the world’s second oldest profession. The folks who started the world’s oldest profession needed a sign.


American Sign Museum Names New Executive Director

3 Things Print Pros Must Do to Build Stronger Relationships in the Interiors Market

Graphics Turn an Eyesore Cooler Into a Showpiece Promo in Historic Plaza


Bulletins
Get the most important news and business ideas from Signs of the Times magazine's news bulletin.
-

 Tip Sheet1 week ago
Always Brand Yourself and Wear Fewer Hats — Two of April’s Sign Tips
-

 Ask Signs of the Times3 days ago
Why Are Signs from Canva so Overloaded and Similar?
-

 Real Deal1 week ago
A Woman Sign Company Owner Confronts a Sexist Wholesaler
-

 Benchmarks5 days ago
6 Sports Venue Signs Deserving a Standing Ovation
-

 Photo Gallery21 hours ago
30 Snapshots of the 2024 ISA Sign Expo
-

 Editor's Note2 weeks ago
Why We Still Need the Women in Signs Award
-

 Women in Signs1 week ago
2024 Women in Signs: Megan Bradley
-

 Photo Gallery1 week ago
21 Larry Albright Plasma Globes, Crackle Tubes and More