Digital Printing
Rules of Engagement
The Traffic Audit Bureau and Nielsen Outdoor prove outdoor advertising’s effectiveness.
Published
17 years agoon

A revolution is taking place in outdoor advertising that’s likely to cause radical change. Such venerable media-research services as Nielsen (the outdoor division) and outdoor’s own stalwart, the Traffic Audit Bureau (TAB), have launched ambitious initiatives to devise a dominant audience-measurement system.
TAB CEO and President Joe Philport has announced, “The outdoor industry will no longer be sitting on the sidelines watching research innovation. We will be leading it.”
Lorraine Hadfield, Nielsen Outdoor’s managing director and director of international audience measurement, said, “You can estimate the number of people passing outdoor signs, but who they are and where they come from has never been measured before. We want to integrate outdoor measurement with other media and market measurements. Advertisers want to understand the consumer, and, to do this, we need to move beyond single-medium research silos.”
But, why bother with outdoor, the oldest advertising medium around? Because you can’t scroll, surf or click past it when you’re driving. Also, outdoor ads are designed to grab attention and deliver a punch at a glance.
Most importantly, billboards and their ilk have experienced a decade-long growth cycle. Outdoor typically accounts for roughly 2.2% of overall advertising spending; this piece of the pie totaled $7.2 billion in 2006, compared to $6.3 billion in 2005 and $5.8 billion in 2004. Total outdoor-advertising revenue grew 7.9% in the second quarter of 2007, compared to the same period last year.
A 2007 Wachovia study posited TAB’s new measuring system “can at least double this to 4.4%, adding another $7 billion of revenue.” The TAB project, which is fully funded, maintains support from major advertising agencies. Nielsen has also invested significantly in its GPS-based system to develop hardware, software, measurement and sampling techniques.
AdvertisementIs it worth it? TAB and Nielsen explain why they think so.
Learning to count, present tense
A credible system helps media buyers and sellers easily measure a medium’s audience by using standardized language and metrics. Media buyers want a straightforward answer to a simple question: How many people does this medium deliver?
Ratings (or impressions) are an advertising message’s number of exposures for a population segment. The higher the rating, the higher the advertising rate. Two other metrics also assess the advertising campaign. Reach is the number of individuals who are exposed to the campaign, and frequency is the average number of times an individual sees the ad.
Media outlets use various monitoring measurements to determine audience size and characteristics. Nielsen Media Services rules broadcast TV-ratings systems, which select representative viewers, whose viewing habits are tracked through their electronic “people meter” system, to yield gross impressions per program and average commercial minute. Arbitron measures radio audiences, which are determined primarily with a diary system.
The Audit Bureau of Circulation and the Business Publications Audit of Circulations check periodical circulation, which hinges on how many people read a particular magazine or newspaper. They validate circulation accuracy based on the number of copies distributed and sold, and provide a total average circulation, which equals the number of copies per issue divided by the number of issues.
AdvertisementOnline media similarly derive the equivalent of circulation data from site- or server-user log data, which is combined with panel-based research from Nielsen and other services to generate the equivalent ratings data.
Though other media measure their audiences in various ways, they present total audience estimates to media buyers to enable them to determine cost per thousand (CPM), or the cost for generating 1,000 exposures, or cost per point (CPP), which is based on ratings points, to select the most cost-effective route.
Even though media planners know outdoor advertising reliably delivers their messages for reasonable costs, many dismiss industry numbers as measures of gross delivery. Outdoor-advertising measurements have been based on traffic counts for road segments and diary systems that rely on ad recall. But, ask yourself, can you remember what you saw while you were driving yesterday? Also, passersby don’t necessarily see all outdoor units in an area. Other factors remained uncounted: the number of vehicular passengers, pedestrians and “eye dwell,” which signifies a passerby has noticed an ad.
Billboards are typically located in high-traffic areas, where consistent, daily, traffic patterns yield reliable forecasts. Traffic-engineering systems, run by state and municipal Departments of Transportation (DOTs), study traffic patterns and routes, which help determine gross impressions and subsequent reach and frequency estimates. Essentially, primary counts represent the number of vehicles that travel a road segment daily in both directions. These studies are generally in the public domain and readily available.
TAB converts these counts into its proprietary “daily effective circulation” (DEC), which matches billboard inventory submitted by plant operators against nearby traffic counts. The TAB method has traditionally yielded an “opportunity to see” for drivers 18 years or older, passing nearly half a million units of inventory, in more than 200 designated market areas (DMAs).
AdvertisementThe new TABulation
In 1933, TAB was created under the sponsorship of the American Assn. of Advertising Agencies, the Assn. of National Advertisers and the Outdoor Advertising Assn. of America (OAAA) as an independent, nonprofit organization to audit the circulation of outdoor-advertising displays. TAB has three major industry segments – advertisers, advertising agencies and outdoor media companies – to ensure accountability.
In 1990, TAB was renamed the Traffic Audit Bureau for Media Measurement to reflect its merger with the Out-of-Home Measurement Bureau and the expansion of its auditing activities. Little changed in TAB’s first 70 years, but, in December 2000, TAB began a lengthy process to dramatically upgrade its standardized audit methodology. The new methodology is based on a market-centric, database approach; TAB now gathers all raw traffic data, on a DMA basis, to calculate DEC. Previous audits were done on a plant-centric basis, in which individual plant operators gathered their own counts. New audits began in January 2005.
Five years ago, when Philport joined the organization, audits were being transferred from pencil-and-paper to a database. Board members insisted on a new measurement system that provided more consumer information, but “no fixed idea about what was to come next existed.” Membership forums were held to assess their needs, followed by the formation of technical committees to study best practices internationally.
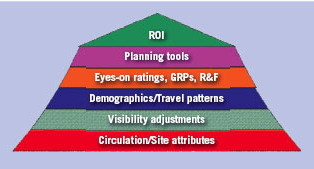
TAB members and worldwide “best practices” identified several key components of a new measurement system:
• Demographic ratings should be available for each inventory unit in all 200+ U.S. markets.
• All ratings should be based on “Eyes On,” or the likelihood the audience will notice the ad. “This makes outdoor the first medium to report commercial audiences,” Philport said.
• An integrated system is the only, cost-effective way to deliver the previous two specifications.
Integrated outdoor research has been successfully introduced in such markets as the United Kingdom and Germany. The integrated audience-measurement system comprises four primary components:
1. Traffic counts. More than 90% of the traffic counts is collected by DOTs. Also, Transearch Group, a Toronto-based company that authenticates outdoor-circulation data, has developed circulation-measurement models for nontraditional outdoor (such as mobile media and place-based advertising on campuses, restaurants, bars and shopping malls). Pedestrian traffic will be measured separately and integrated into the measurement system before 2009.
2. “Eyes On,” or visibility-adjustment indices (VAI). Determining the likelihood that a driver notices an outdoor ad will help measure engagement. Currently, this is measured by simulating a car-driving experience, using videos. “Eyes-on” tests will use eye cameras to capture visual responses to different units in various settings using filmed drive-by and walk-by scenarios that represent OOH range and complexity.
3. Travel surveys. MediaMark Research Inc., an NYC-based consumer-research company, is conducting travel surveys that will provide demographic data of travelers in 15 markets, including the top 10. Roughly 4,200 computer-assisted surveys in five of the 10 top markets, and 45,000 face-to-face diary surveys, will yield a high response rate and quality data. The data will measure trips taken, the respondents’ demographics, the trips’ purpose and the mode of travel.
4. Modeling/analytics. Telmar Worldwide, a computer-based, advertising-information-services supplier whose U.S. headquarters are in NYC, will integrate traffic counts, travel surveys and “eyes-on” adjustments, plus census and transportation data, to create a consistent audience measurement in all 200+ DMAs.
Currently, advertisers buy outdoor products based on DECs. The new system will provide demographic data and “eyes-on” information so advertisers know who’s actually viewing their ads – consumers who are “likely to see,” rather than those having an “opportunity to see.”
“We’ll be measuring travel, not just media,” Philport said. Also, TAB will own the data and the methodology.
TAB will continue to conduct its circulation audits, but will use the new ratings-derived data to provide total audience estimates that all other media currently report.
Traditional boards are the first focus of the new system, but digital boards, transit, street furniture and alternative ads will be measured once the traditional billboard system is fully operational.
Philport has allowed time for membership feedback and training sessions before releasing data for the test markets in Spring/Summer 2008 and for all 200 markets in Fall/Winter 2008. Early questions dealt with technical questions surrounding infrastructure, cost and value, and current questions now concern methodology and the achievement of a “world-class system.”
Philport said, “One thing that can’t be overlooked is the industry’s commitment to our efforts. They recognize this system is being designed for their benefit, and they share that excitement.”
Nielsen
Nielsen Outdoor hopes to accomplish for outdoor advertising what Nielsen Media Research has long done for TV: provide viewership measurements that allow reliable, ROI calculations.
Nielsen Outdoor’s system has added another dimension to outdoor-advertising metrics – GPS. The Nielsen Media Research division, with Seattle-based technology partner RDP Associates, developed the Nielsen Personal Outdoor Device, or Npod, a cellphone-sized device that tracks drivers’ and pedestrians’ movements.
The Npods rely on 24 satellites to pinpoint users’ locations every five seconds. Nielsen converts this travel data into detailed demographic data, delivering reach/frequency and rating data for these key demographic breaks. Hadfield said. “Nielsen Outdoor was conceived based on this state-of-the-art technology as it realized a system that relies on people’s recall yields less than scientific results.
“GPS accurately measures people’s exposure to outdoor advertising, because we know for sure that a person went past a board or was on a particular bus route. We then cross-reference this with traffic stats to get the most robust read,” Hadfield said. “GPS is simple and obvious. The outdoor industry has felt the need for some measure of ‘likely exposure.’ I think, with GPS, the outdoor industry can argue that is has a measurement that is compa¬rable to measures of exposure to other media.”
In 2002, Nielsen Outdoor field-tested the system in Johannesburg in cooperation with the South African Advertising Research Foundation. More than 100 drivers were outfitted with a GPS meter in their car trunks. The travel information, compared with a map of 380 geo-coded outdoor sites, covered bus shelters, posters, bulletins and billboards. When the travel path intersected with the mapped outdoor displays, the “opportunity to see” was dated and time stamped, along with the direction and travel speed.
When Nielsen rolled out its first, U.S. phase in Chicago in 2005, it asked 830 randomly recruited respondents, who were proportionately representative of the Chicago DMA (13 counties), to tote Npods around the DMA for nine days while they drove or walked. The resulting 100 million data points were linked to TAB DECs to estimate consumer exposure to roughly 12,500 outdoor faces in the Chicago market. This produced a demo¬graphic profile of sites that would form an outdoor campaign and quantified frequency, exposure and average income.
For example, the Chicago study revealed outdoor advertising has an upper-income skew as it targets a mobile population, and an outdoor site’s location isn’t the only determinant of the type of people passing that site. In some instances, more than 60% of exposure comes from people living far away from the site location. Also, Chicago DMA residents who are at least 18 years old are exposed to an average of 40 outdoor signs a day, 66 for adults who live in the city.
Hadfield said, “Now we can tell you not just how many people saw a sign, but who they are and exactly how often – by age, sex and income. The previous measurements methods estimated the number of people passing a board, but who they are and where they came from hadn’t been measured.”
Beyond Chicago, the next step is a Los Angeles rollout, with the information available by later this year.
After data is collected in several markets, the databases will be fused with data from TV, the Internet and “product purchase” data. Here’s where Nielsen will assert its corporate mission to “bring together insights from across our businesses to provide a new breadth of understanding about consumers, their attitudes, their media behavior and their purchases.” Using its core TV rating with its Internet, outdoor and Homescan scanning services, Nielsen plans to fuse its services to provide what Hadfield described as “a realistic and reliable exposure measurements to one or more media to help media buyers assess their multimedia needs for ad campaigns.”
For example, the TV/outdoor link estimates the time spent indoors at home and time spent exposed to billboards. “This reflects the complementary nature of the two media,” Nielsen’s Pete Doe said. “If you’re indoors watching TV, you’re not going to be exposed to billboards.”
Nielsen’s Doe and Mediacom Outdoor’s John Connolly outlined the integrated plan at the Advertising Research Foundation’s Audience Measurement Symposium June 26, 2007. Their presentation, “Billboards, Buses and Malls (and Other Media Too),” showed how the system will work, using a random-digit sample of 830 adults in the Chicago study. The sample’s closely matched demographic classifications can show media buyers how different media interact and how they relate to product-purchase information.
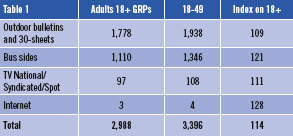
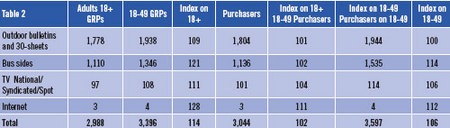
The Chicago example began with each medium’s gross rating points (GRPs), or the sum of media ratings (the percentages of the target audience an ad reaches). GRP equals frequency multiplied by the reach percentage. If an advertisement appears more than once, the GRP represents the sum of each GRP. Thus, a TV ad that airs five times and reaches half the target audience would have a 250 GRP.
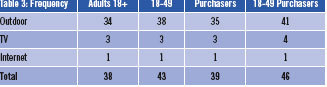
The Chicago study revealed bulletins, 30-sheets and bus sides delivered high reach and frequency numbers among all demographic groups in that area. Bus sides and bulletins complement each other, though bulletins add little to unique reach. Frequency of exposure is greatest for those exposed to all three media types (bus sides, bulletins and 30 sheets).
Compared to the TV and Internet frequency rates, outdoor achieved 89% of the total (41 of 46); TV, 8% (4); and the Internet, 2% (1).
Nielsen’s upcoming Outdoor Smaller Market Analysis System (OSMAS) will also deliver audience estimates for smaller markets without a primary Npod survey. Nielsen models the overall system by using population estimates, outdoor exposure for demographics from primary surveys, local-market traffic counts from local government sources, vehicle-occupancy facts from the National Household Travel Survey and board-illumination factors.
Hadfield explained OSMAS measures not only ad campaigns, but also individual inventory units, when combined with traffic-count information. “Campaign effectiveness can be measured as well, because the GPS measurement provides a direct measure of duplication [how many times the ad is exposed] across the boards,” Hadfield said.
“The attractiveness of a sign is based on the creative, its intrusiveness and whether the audience is in the target market. At Nielsen, we can provide accurate estimates of the demographics passing the sign, so ROI can be calculated against the advertiser’s target market,” Hadfield said. “But, ultimately, ROI is measured in incremental sales, and only the advertiser can calculate that based on CPP/CPM for the campaign versus incremental sales.”
What’s next?
Measurement systems aren’t implemented overnight. Media buyers must be assured their advertising dollars are being well spent, and everyone involved must learn new terminology and metrics. But TAB’s and Nielsen’s systems have already proven outdoor advertising’s worth to advertisers and hope to improve its multimedia clout.


SPONSORED VIDEO
Introducing the Sign Industry Podcast
The Sign Industry Podcast is a platform for every sign person out there — from the old-timers who bent neon and hand-lettered boats to those venturing into new technologies — we want to get their stories out for everyone to hear. Come join us and listen to stories, learn tricks or techniques, and get insights of what’s to come. We are the world’s second oldest profession. The folks who started the world’s oldest profession needed a sign.
You may like


Advertisement
Subscribe

Magazine
Get the most important news
and business ideas from Signsofthetimes Magazine.
Advertisement
Most Popular
-

 Tip Sheet4 days ago
Always Brand Yourself and Wear Fewer Hats — Two of April’s Sign Tips
-

 Business Management2 weeks ago
When Should Sign Companies Hire Salespeople or Fire Customers?
-

 Women in Signs2 weeks ago
2024 Women in Signs Award Winners Excel in Diverse Roles
-

 Real Deal5 days ago
A Woman Sign Company Owner Confronts a Sexist Wholesaler
-

 Benchmarks16 hours ago
6 Sports Venue Signs Deserving a Standing Ovation
-

 Editor's Note1 week ago
Why We Still Need the Women in Signs Award
-

 Line Time2 weeks ago
One Less Thing to Do for Sign Customers
-
 Product Buying + Technology1 week ago
ADA Signs and More Uses for Engraving Machines