Business Management
The 2017 State of the Industry Report
Companies expect sales and profit margins to continue growing.
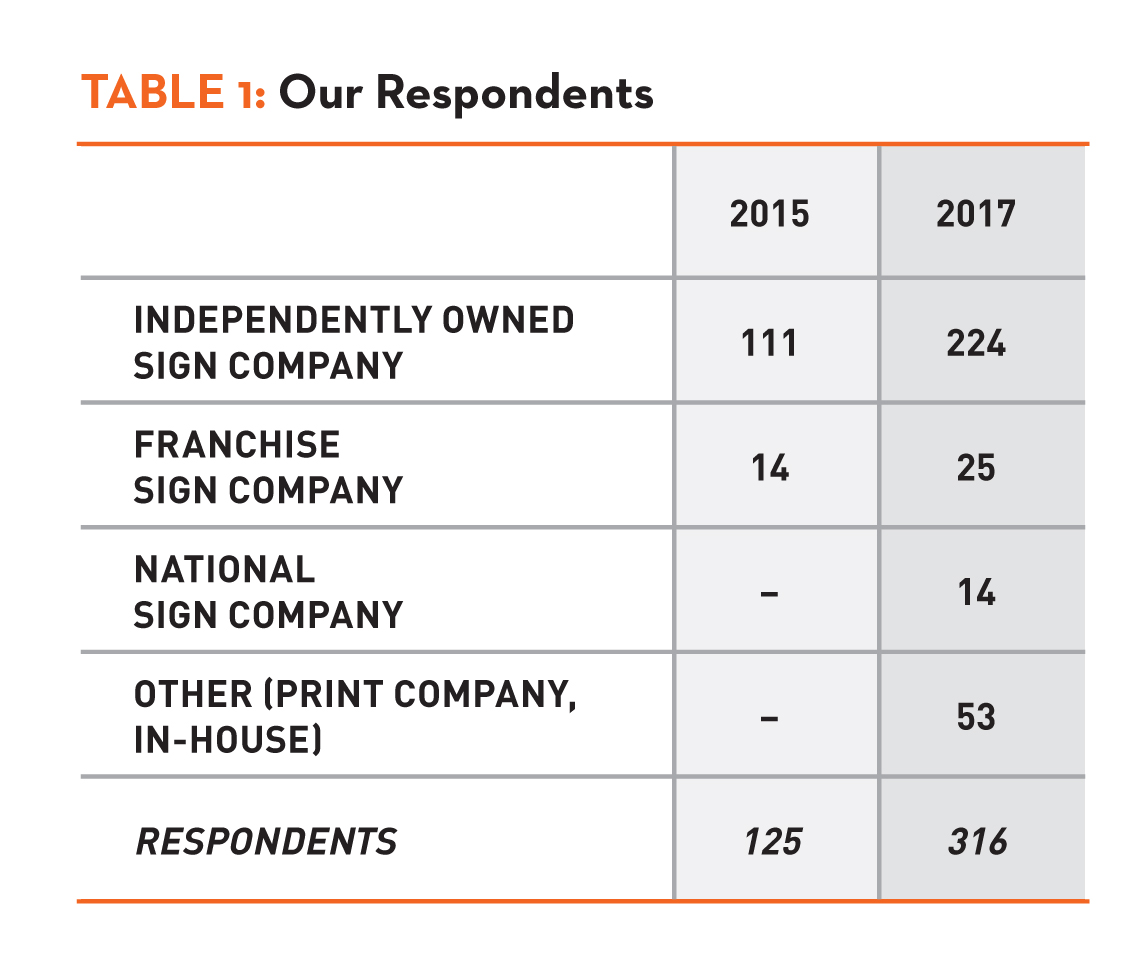
RESPONDENTS AND EMPLOYEES
We conducted our survey from May 24-June 9 and received 316 responses, significantly more than the two 2015 surveys used for some comparisons here. Among them, 71% identified as independently owned sign companies, 8% as franchise sign companies and 4% as national sign companies (Table 1). Another 17% selected “Other” and comprised mainly print companies and in-house shops. Because we wanted to survey sign companies only, the survey ended there for those companies.
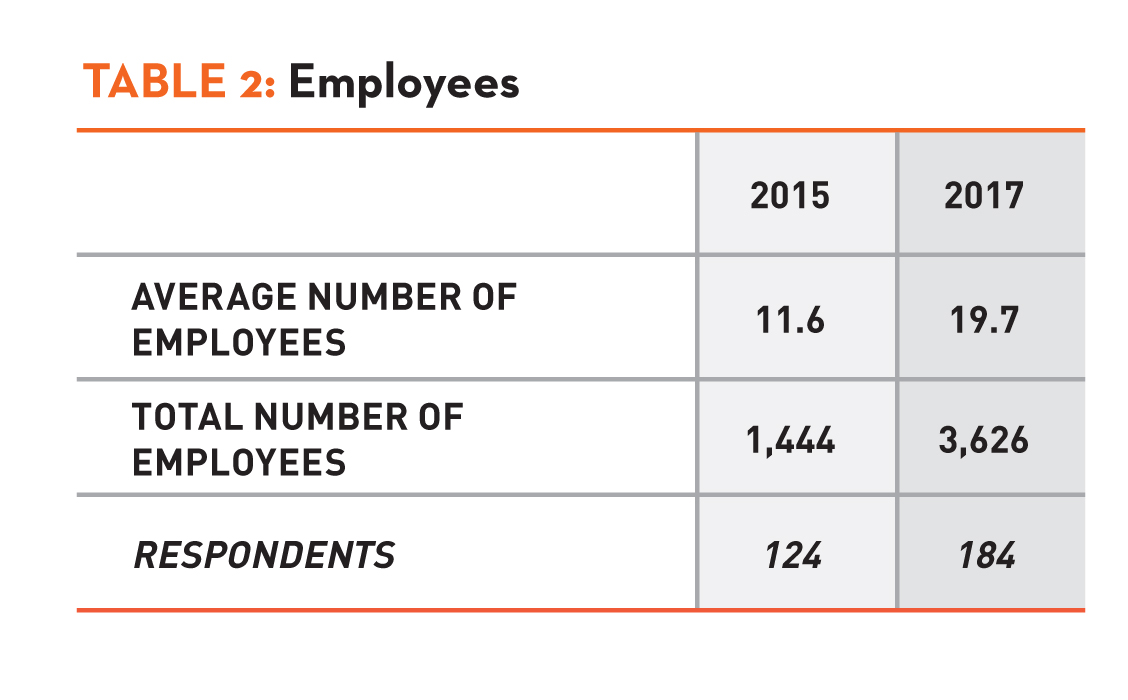
Of the 184 responses to our question about the number of full-time-equivalent employees (Table 2), the average was 19.7 employees/company. However, because 142 responses were below the average – and 110 (nearly 60%) respondents reported 10 or fewer employees – we have to consider the average skewed by a few, large firms. Our 2015 surveys provide some helpful background here: Electric sign companies averaged more than 34 employees each while commercial companies averaged just under 12. So while a smaller number of large, electric sign companies pulls up the overall average, it’s accurate to say a comfortable majority of all sign companies can count their employees using one or two hands.
SALES AND PROFITS
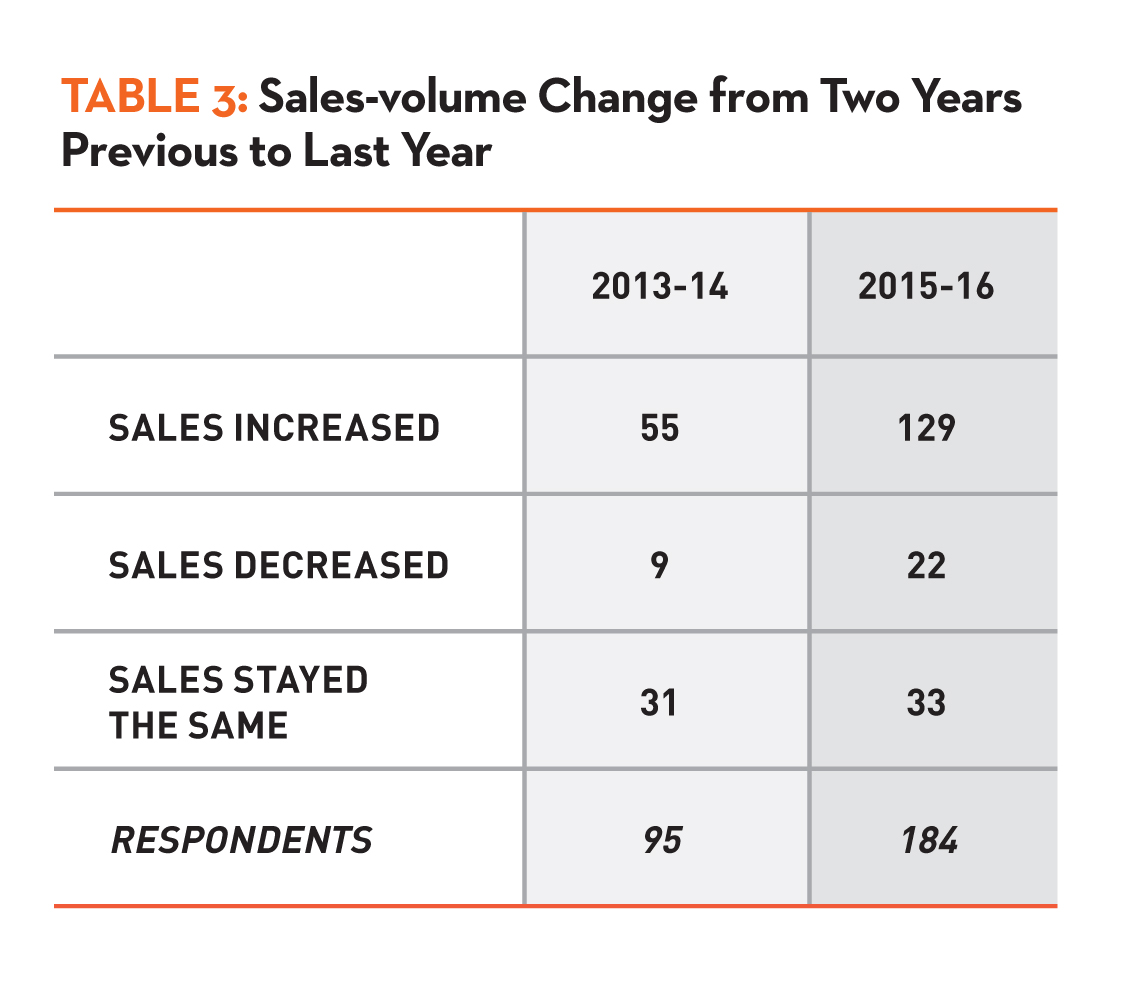
Respondents reported an increase in sales volume from 2015 to 2016 (Table 3), versus those reporting a decrease, by nearly 6:1. Nearly 30% of companies reported their sales stayed the same or declined; the other side of that coin is that more than 70% of companies reported increased sales last year over the previous.
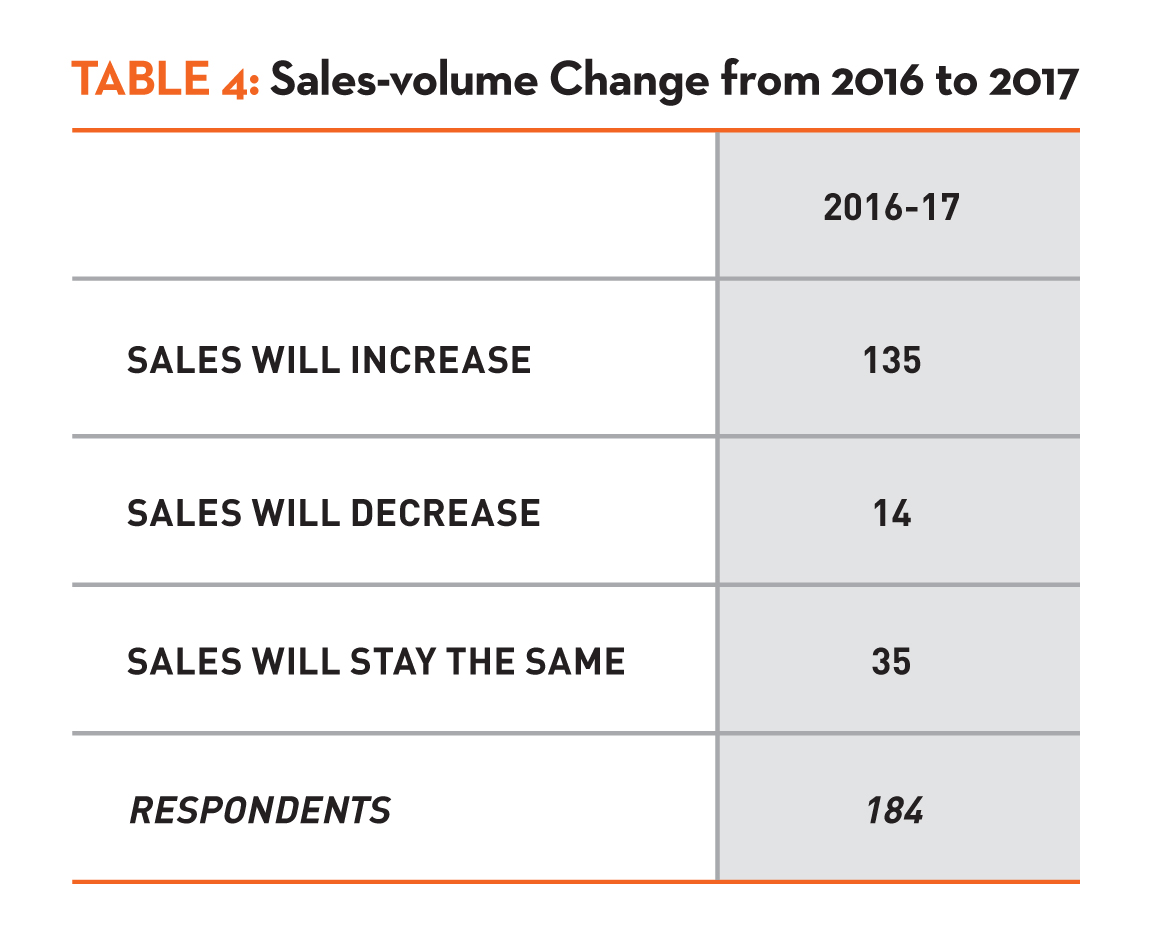
And when asked about this year’s sales (Table 4), respondents reporting an expected sales increase outnumbered those expecting a decrease by more than 73% to 8%!
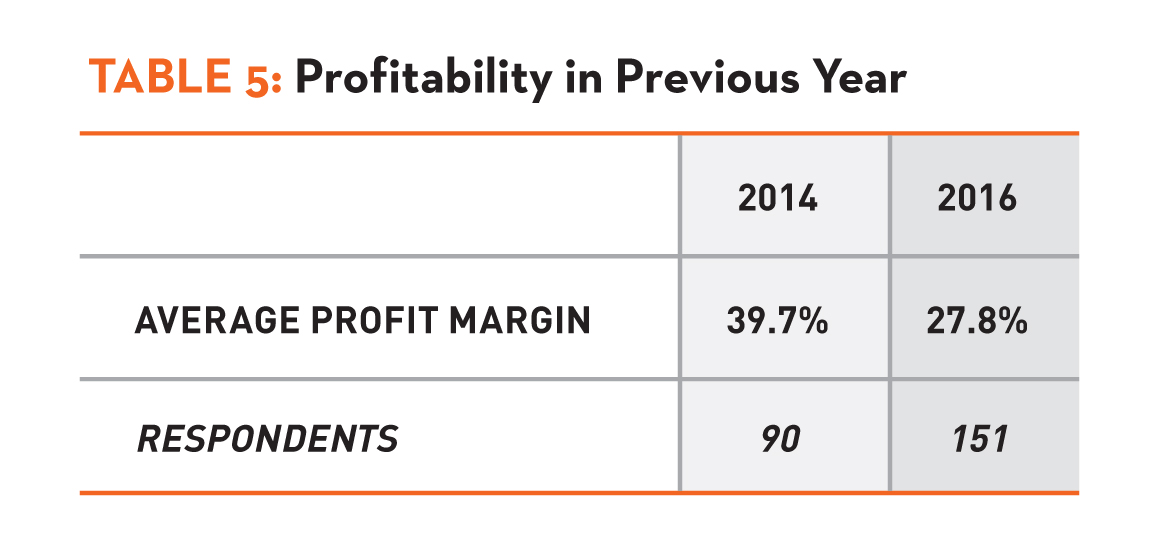
We received 151 responses to our question about 2016’s profit margin (Table 5) with an average of 27.8%. With 71 responses above the average and 80 below, the average falls close to the median. Notably, more than 19% of respondents reported a profit margin of 10% or less, indicating that this small but significant number of companies is facing some financial risk.
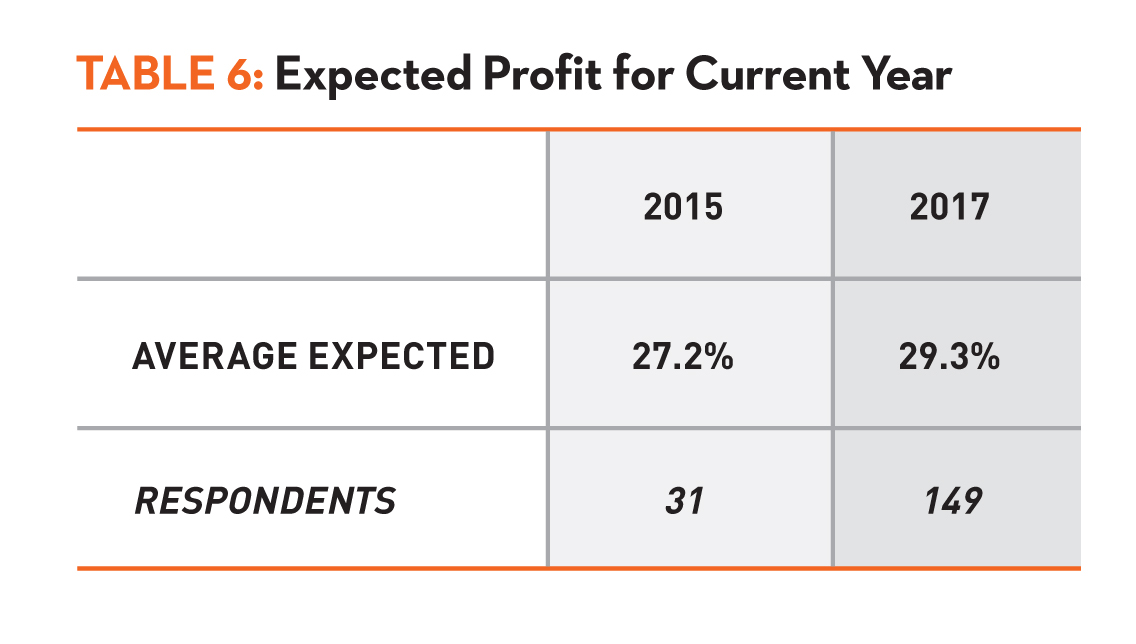
As for 2017’s expected profit margin (Table 6), almost as many (149) responded, with 29.3% as the anticipated average. Here, 75 responses fell above the average and 74 below, so the average nearly equals the median. For comparison, our 2015 electric survey found a 27.2% anticipated profit margin for 2016 and our commercial survey, an expectation close to 40%, which was, it seems, a bit too buoyant.
EQUIPMENT AND INVESTMENT
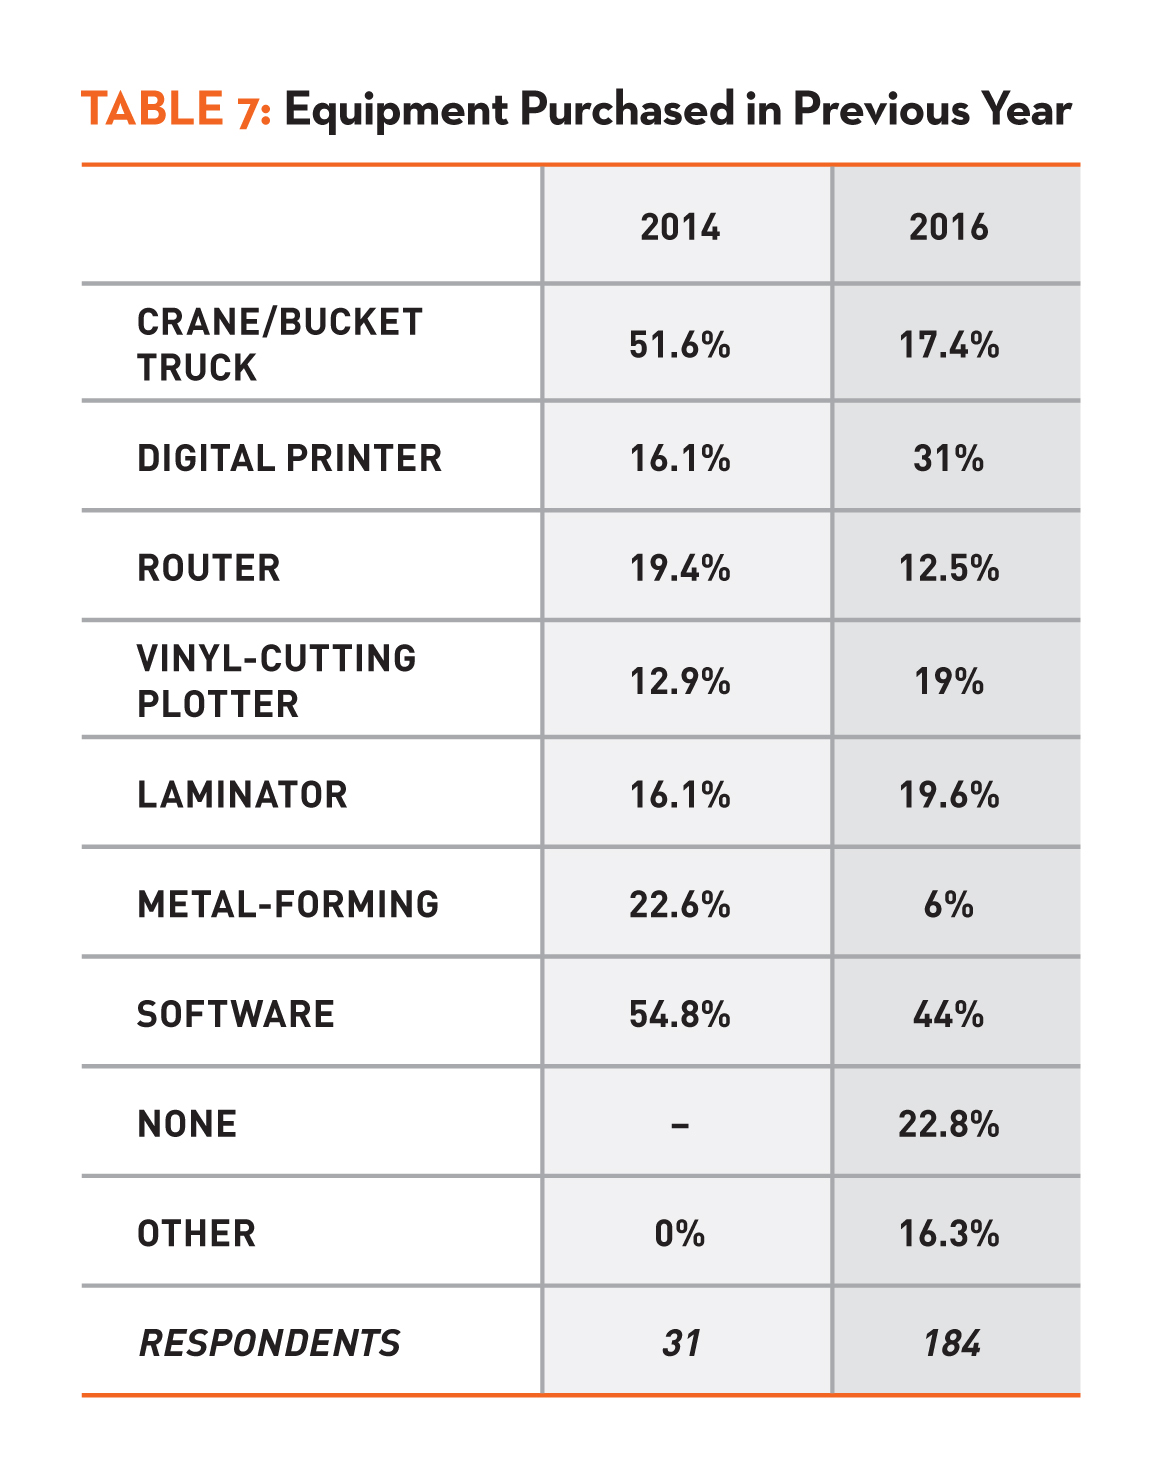
Of the 184 respondents to our question regarding equipment purchased in 2016 (Table 7), 142 (77.2%) reported purchase activity. Among them, software led the buying list among the 44% of companies that made some sort of purchase. Digital printers (31%), laminators (19.6%) and vinyl-cutting plotters (19%) followed, leading crane/bucket trucks (17.4%), routers (12.5%) and metal forming (6%) as other popular equipment purchase options. Of the 16.3% who selected “Other,” most of the filled-in responses cited laser engravers and computers/office equipment. Software also led our 2015 survey of electric companies, with crane/bucket trucks second.
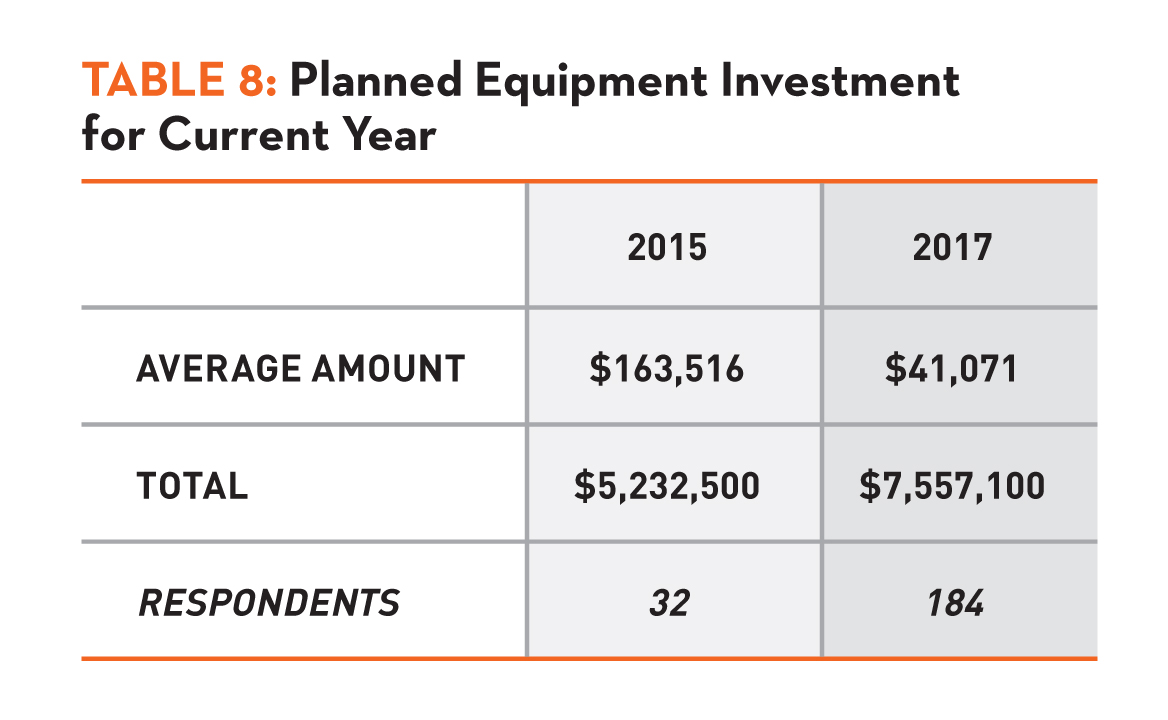
The same number of respondents plan to invest an average of $41,071 in equipment in 2017 (Table 8). Here, as with the number of employees per company, this average clocks in well above the median with only 49 responses above the average and 135 below. In fact, 48% reported plans to invest $10,000 or less and 21% reported no investment plans at all for this year. Taken together, nearly 70% of the respondents plan investments under five figures for the year, perhaps again reflecting the plans of smaller shops.

THREATS TO THE INDUSTRY
Introducing a new question, we asked what companies see as the greatest threat to the signage and graphics industry (Table 9); 184 respondents had several choices. Chief among the perceived threats reported was price competition or diminishing profit margins with 32% companies fearing this, followed by the increasing number of non-sign companies (e.g. print shops) offering signage services at 27.7%. At some distance thereafter were recruiting and retaining staff at 14.1%, not sufficiently diversifying products/services or keeping up with changing signage demands at nearly 9% and the increasing number of sign companies in the market at just under 5%.
Our “Other” category garnered 23 responses, exactly one-eighth of our total. The two main threats called out here were led by restrictive sign codes and sales lost to internet and “fly by night” companies doing sign work. One respondent lamented “the commoditization of the trade.” Another wrote in “Donald Trump,” which may or may not have been tongue-in-cheek; we’ll have to wait and see.
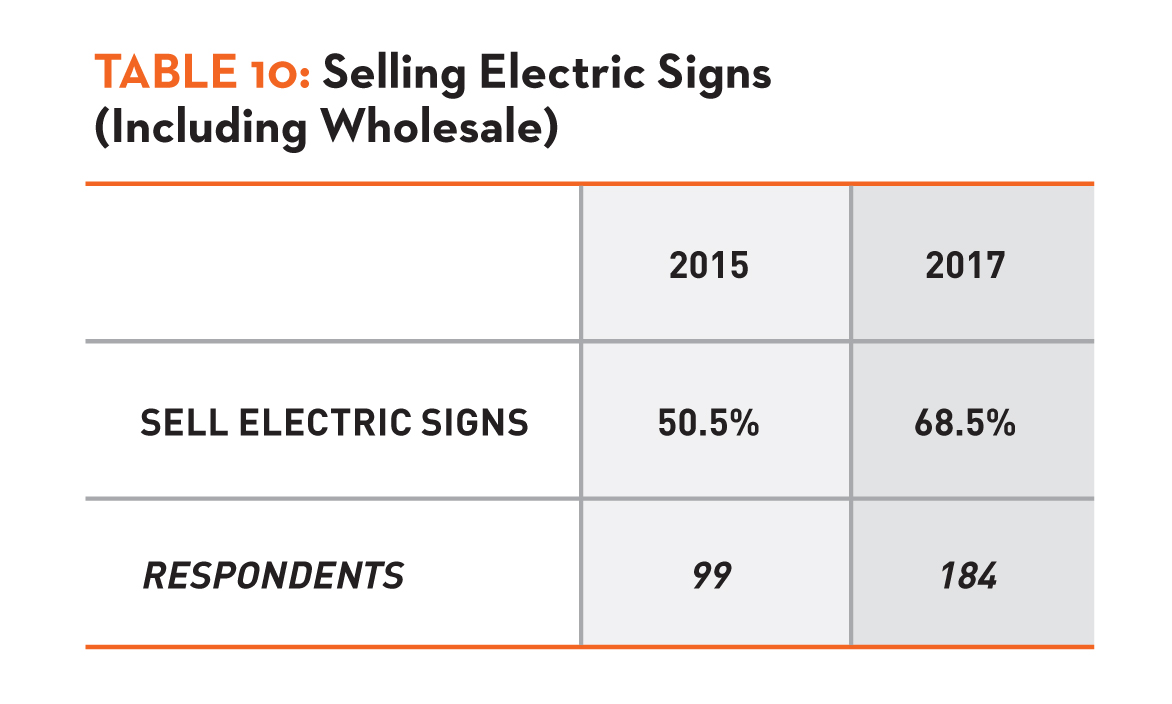
SELLING ELECTRIC SIGNS
More than two out of every three respondents to answer this question reported selling electric signs, including electric signs bought wholesale (Table 10). However, 132 respondents skipped this question while 184 respondents completed it. If we add 132 to the 58 who answered “no,” we get 190 companies not selling electric signs and 126 that do, so perhaps it’s more accurate to estimate that just under 40% of all sign companies sell electric signs while just over 60% do not.
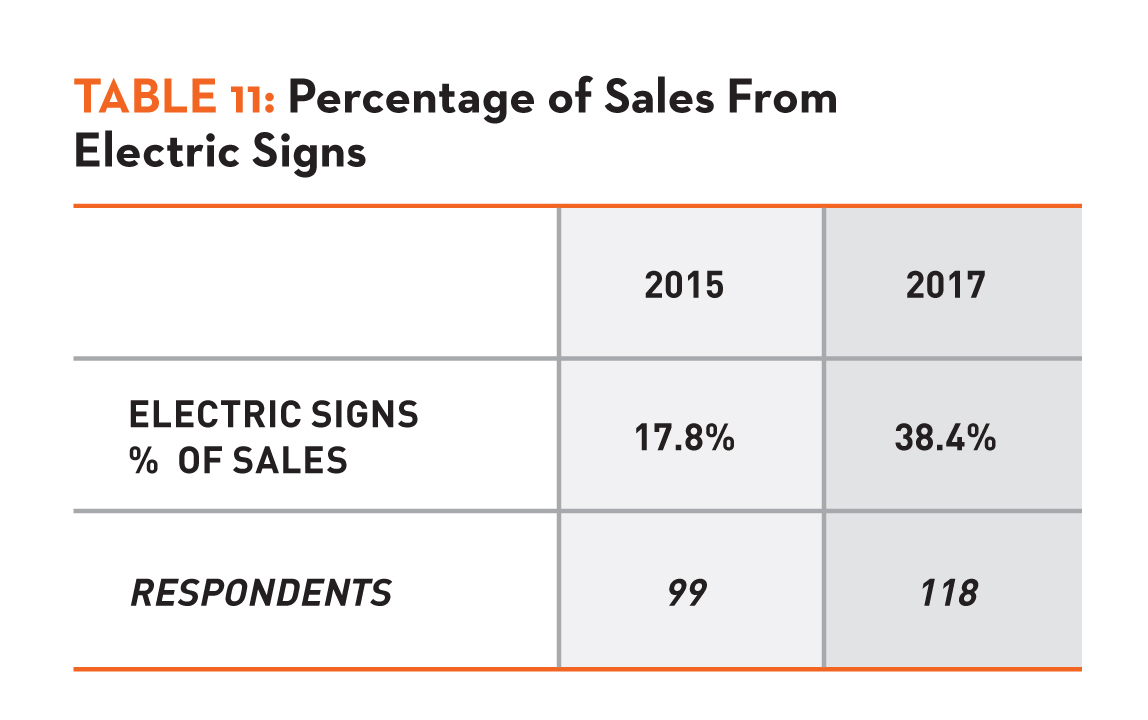
Among the 118 companies that offered the percentage of their total sales that comes from electric signs (Table 11), the average was just over 38%. Here, the more electric sign-centered companies taking the survey likely skewed this average significantly above the median, with only 49 reporting an average above 38% and 69 reporting an average below. More than 30% of the companies reporting sales of electric signs stated that those sales comprise 10% or less of total sales. In our 2015 survey of commercial shops, slightly more than half sold electric signs for an average of just under 18% of their total sales.
ELECTRIC SIGN TYPES AND ILLUMINATION
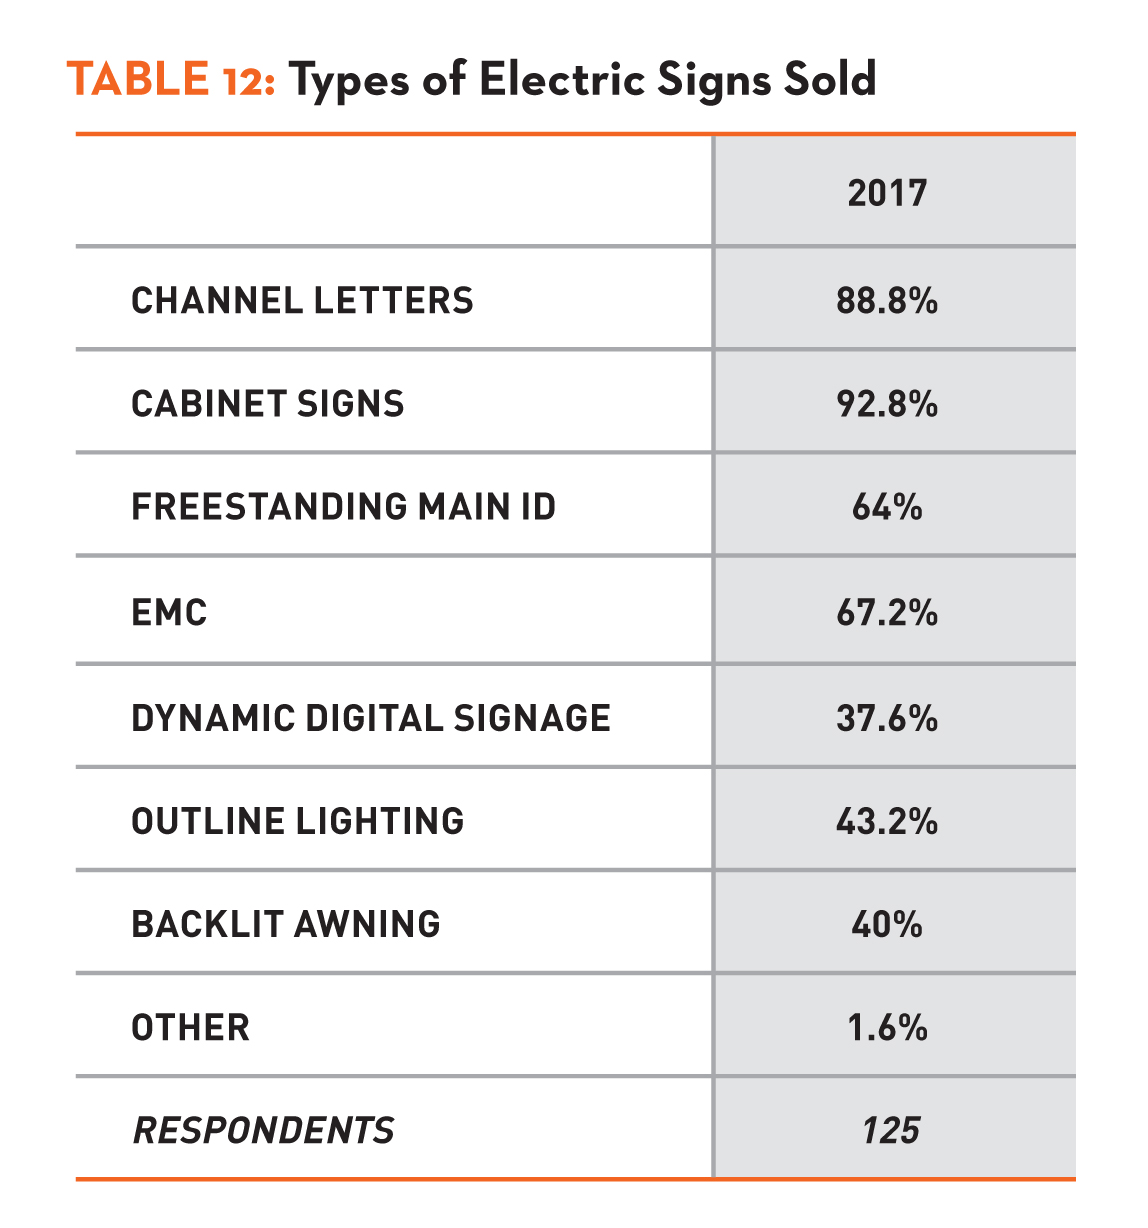
We received 125 responses to our question on the types of electric signs companies sell (Table 12), with cabinet signs offered by just under 93% of companies, followed by channel letters (88.8%), electronic message centers (67.2%) and freestanding main ID signs (64%). Fewer than half but still a significant number offer outline lighting (43.2%), backlit awnings (40%) and dynamic digital signage (37.6%). Our 2015 survey of electric shops had channel letters ahead of cabinet signs, with freestanding main ID and EMCs following.
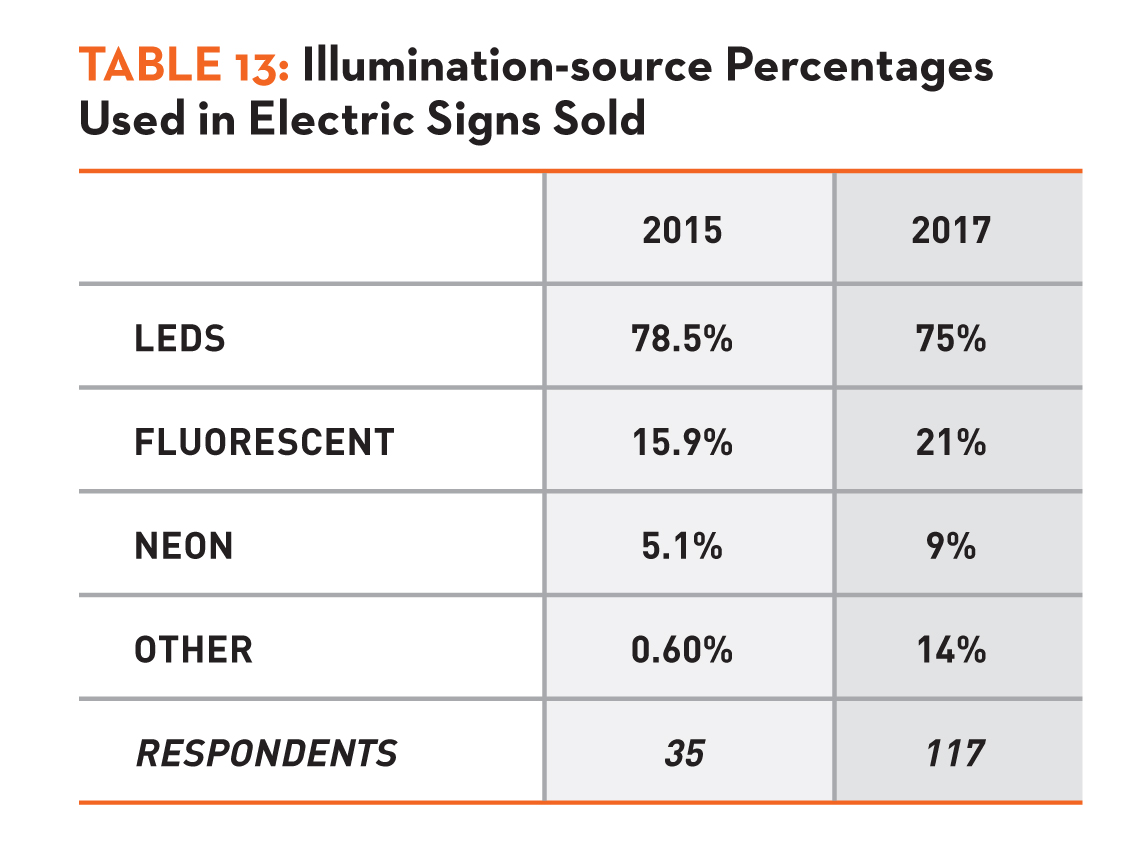
Among the 117 responses we received on the illumination sources for their electric signs (Table 13), 115 – more than 98% of companies – offer LEDs, and an average of 75% of their total electric signs are LED illuminated. No other illumination source comes close, with fluorescent in second place, used by 96 respondents and averaging 21% of their total; neon comes third, used by 74 respondents and averages 9% of the total. This breakdown reasonably resembles our 2015 findings. Interestingly, 26 of this year’s respondents (22% of the total) reported using some “Other” illumination source, and for an average of 14% of their total signs. Unfortunately, our survey did not collect these other illumination source(s).
CAS/COMMERCIAL SIGN TYPES/MATERIALS
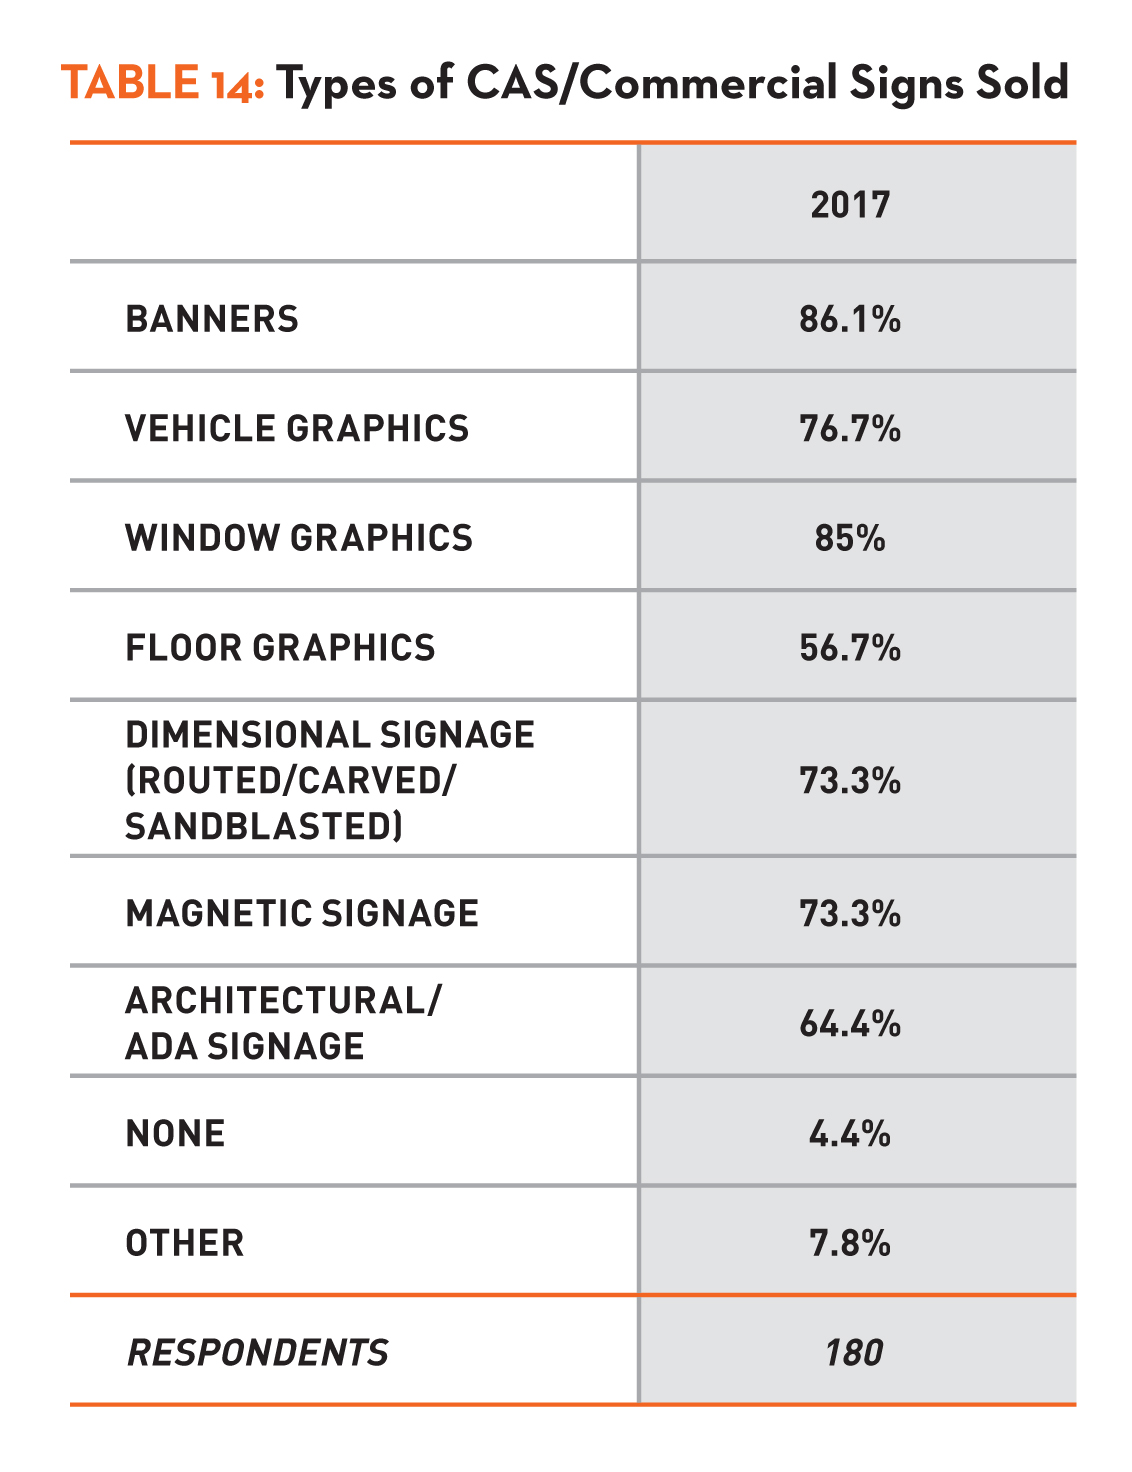
Of the 180 respondents to the types of CAS/commercial signs they sell (Table 14), most companies offer a full range: banners, window graphics and vehicle graphics in 76.7% or more of shops. Dimensional, magnetic, architectural/ADA signage and floor graphics are also on the menu at well over half (56.7%). In other words, a comfortable majority of shops offer all seven of these sign types. Compared to our 2015 survey, floor graphics and architectural/ADA signage have greatly increased. Our “Other” category this year netted close to 8% with yard signs mentioned most often.
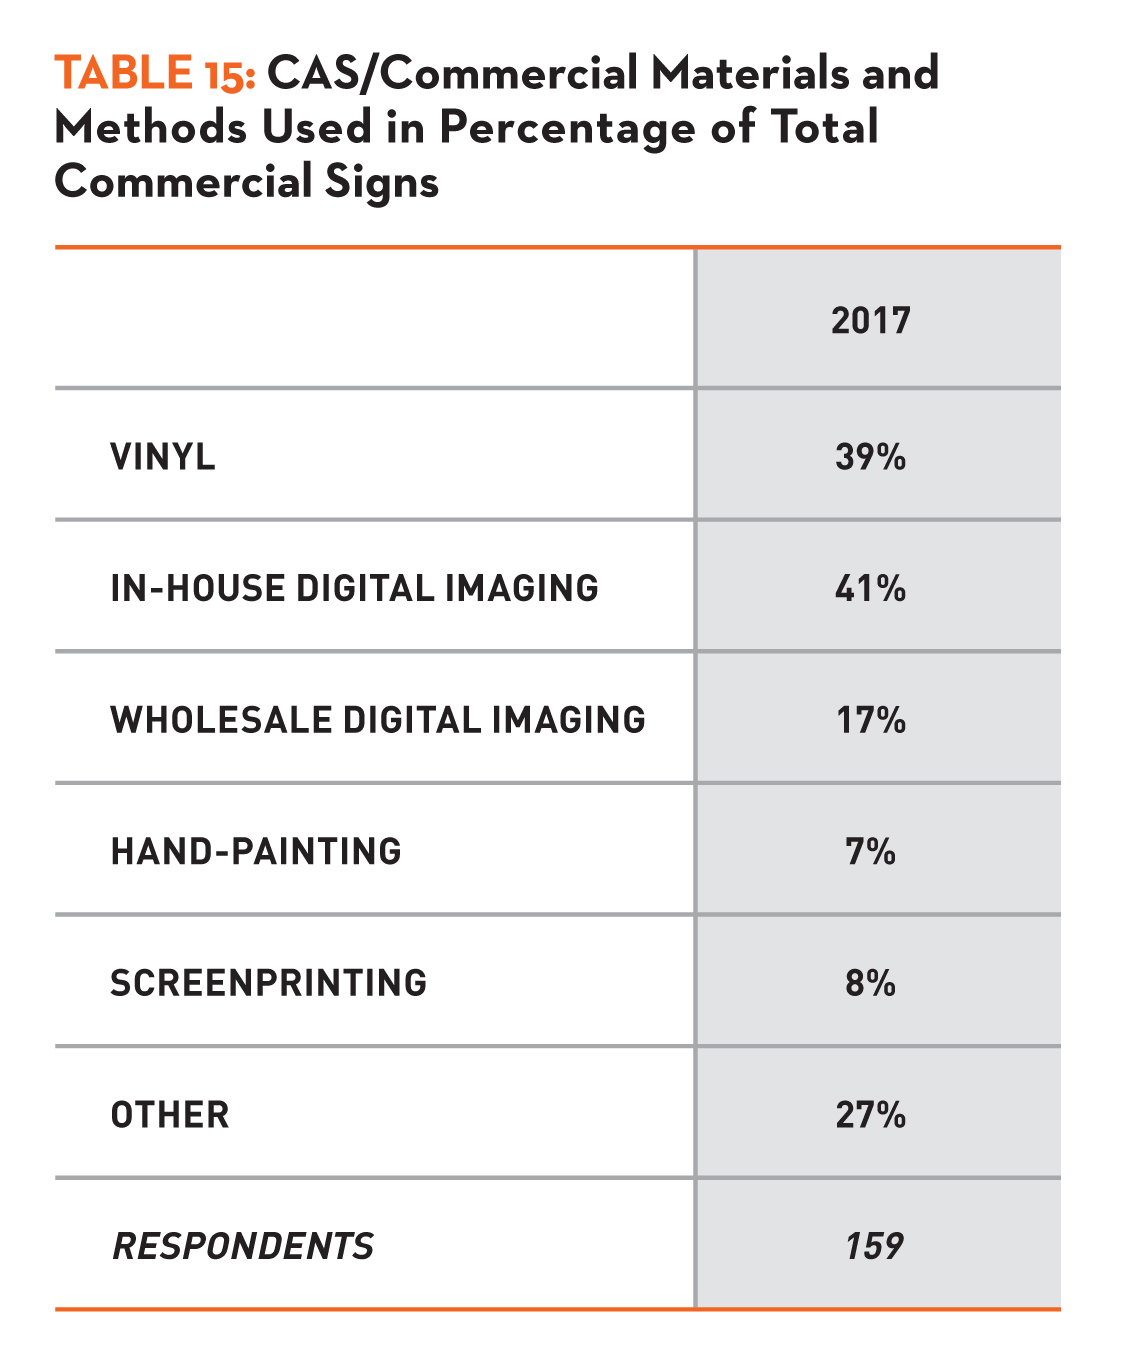
Lastly, on the materials or methods used for the CAS/commercial signs (Table 15), 159 respondents answered. Vinyl led the way, used by 154 (97%) of respondents in an average of 39% of their total commercial signs. In-house digital imaging came next, with 128 responses and 41% of the total, followed by wholesale digital imaging (114 responses, 17% average), screenprinting (85 responses, 8% average) and hand-painting (82 responses, 7% average). Here again, our survey did not collect the 52 “Other” responses (for a significant 27% average) for the materials or methods for these signs. A late, second thought about the choices for this question brings a few other likely materials and methods to mind, such as HDU, aluminum and composite materials as well as routing, carving and engraving methods.
Introducing the Sign Industry Podcast
The Sign Industry Podcast is a platform for every sign person out there — from the old-timers who bent neon and hand-lettered boats to those venturing into new technologies — we want to get their stories out for everyone to hear. Come join us and listen to stories, learn tricks or techniques, and get insights of what’s to come. We are the world’s second oldest profession. The folks who started the world’s oldest profession needed a sign.


ISA Announces New Tradeshows and Meetings VP

5 Reasons to Sell a Sign Company Plus 6 Options

Sign Products Wrap-Up for April


Bulletins
Get the most important news and business ideas from Signs of the Times magazine's news bulletin.
-

 Tip Sheet1 week ago
Always Brand Yourself and Wear Fewer Hats — Two of April’s Sign Tips
-

 Ask Signs of the Times2 days ago
Why Are Signs from Canva so Overloaded and Similar?
-

 Real Deal1 week ago
A Woman Sign Company Owner Confronts a Sexist Wholesaler
-
 Benchmarks4 days ago
6 Sports Venue Signs Deserving a Standing Ovation
-
 Editor's Note2 weeks ago
Why We Still Need the Women in Signs Award
-

 Women in Signs1 week ago
2024 Women in Signs: Megan Bradley
-
 Product Buying + Technology2 weeks ago
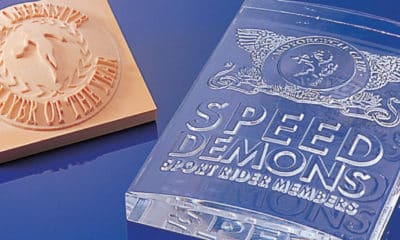
ADA Signs and More Uses for Engraving Machines
-
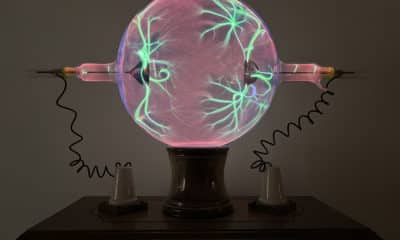
 Photo Gallery6 days ago
21 Larry Albright Plasma Globes, Crackle Tubes and More