The number of responses we received for this eighth-annual study was quite disappointing (the second lowest ever), but they’re sufficient to confidently state that LEDs have grabbed another chunk of marketshare directly from neon, although the latter remains preferred by more than an overall 2:1 ratio. And for the third consecutive year, fluorescent lighting reigns rock steady as the most popular illumination source.
Next year, we will undoubtedly need to ratchet up our sales-volume categories, because companies with annual sales of less than $500,000 are negligibly represented. Similarly, in July’s upcoming Electric State of the Industry (SOI), you’ll see higher level, sales-volume categories.
As usual, we received one response from a disproportionately large sign company, one with annual sales of $100 million. In some instances, we’ll present data with and without that company’s response. For example, in the amount spent on illumination in 2006, even without the $100 million company, the figure significantly establishes a new standard and more than doubles last year’s total. (Remember, any reference to “this year” means 2006 data, and “last year” means 2005.)
Overall, 2006 was a good year, with only four of 53 companies reporting a decline in sales from 2005, and the overall sales-volume increase approached double figures.
Here are some of the highlights, and chronological discussion of the individual tables will follow:
Advertisement
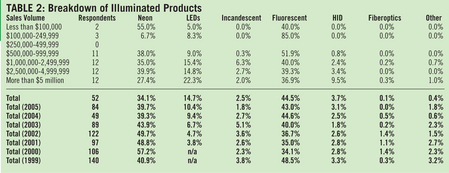
• LED usage continued its ascent to a noticeable record high of 14.7%, while neon’s usage fell to a record low of 34.1% (Table 2). Meanwhile, fluorescent lighting remains the choice illumination source.
• Electronic power supplies, by a small margin, evidence thei r greatest popularity to date. For the first time, traditional ferromagnetic transformers aren’t used twice as often as their smaller, lighter counterparts (Table 7).
• For the third consecutive year, red LEDs are slightly preferred over red neon. Among other colors, white LEDs gained considerable ground, although white neon remains preferred by an approximate 3:1 margin (Table 10).
• “Durability” edged past “initial cost” as the most critical of seven factors when choosing between neon and LEDs. For the first time in four years, “energy savings” didn’t finish last. The range of colors claimed that dubious honor by a slight margin (Table 11).
• The average sales-volume increase for all respondents from 2005 to 2006 fell just below double digits at 9.7% (Table 5).
This is slightly below the 10.4% reported in last year’s Electric SOI (see ST, July 2006, page 101).
Advertisement
• Companies report creating less interior neon than ever (Table 6), which seemingly counters the increased use of electromagnetic power supplies.
• Use of virtually all non-red LED colors has increased as percentages of LED use (Table 9).
• A record low of less than 5% of the respondents said they used more neon in 2006, whereas a majority reported using more LEDs (Table 12).
General statistics
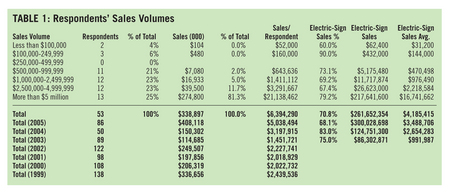
Table 1 shows a very nice mix of companies from different sales levels, once you get past the $500,000 mark. The average sales volume of nearly $6.4 million is easily the highest we’ve seen. Yet even if we delete the $100 million company, average sales volume remains quite lofty at approximately $4.6 million.
Advertisement
Electric-sign sales as a percentage of overall sales are fairly low, at 70.8%. compared to two of the three prior years, when it’s been as high as 83%.
Fluorescent lighting remains the preferred illumination form, holding steady in the mid-40% range for the third consecutive year (Table 2). Meanwhile, LEDs snatched a 4.3% marketshare to set a new benchmark at 14.7%, while neon tripped more than 5% to an all-time low of 34.1%. Despite remaining at the low end of the spectrum, HID lighting showed its best effort to date, at 3.7%. Fiberoptics remain on life support.
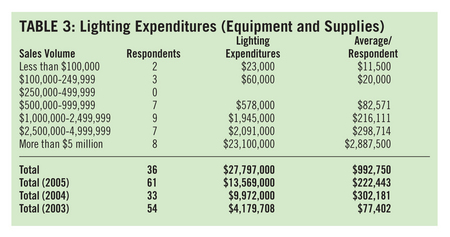
Lighting equipment and supplies expenditures are off the charts. Table 3 shows an average, per-company figure of nearly $1 million, which easily more than triples the previous high. Even without the $100 million company’s response, the $476,185 average more than doubles last year’s figure and rates as more than 50% higher than the previous high of just over $300,000 (2004).
As expected, if our respondents are collectively larger than in any previous year, then their average number of employees should likewise set a new standard. And so it does with 50 average employees, a 20% hike over last year’s 40.7 (Table 4). The ratio of electric-sign fabricators to electric-sign installers continues to widen. For the first time in four years of results, fabricators outnumber installers by more than a 3:1 margin.
For the complete survey results, please see ST, March 2007, pages 98 to 103.


 Tip Sheet1 week ago
 Ask Signs of the Times3 days ago
 Real Deal1 week ago
 Benchmarks5 days ago
 Editor's Note2 weeks ago
 Women in Signs1 week ago
 Photo Gallery1 week ago
 Women in Signs1 week ago