
Sign Companies’ Demographics Uncovered
Locations, markets… even sign pros who’d rather live and work elsewhere.
LET’S BEGIN WITH an overview, the scene from above. We clock where shops are, their shop sizes and settings, their markets, history and products, as well as their total sales. You may be surprised at the portion of survey-takers who would rather live and work somewhere else.
1. In what state/province is your company (or headquarters) located?

ALTERED STATES. Once again, California claims the most respondents of any state (16), followed by Pennsylvania (12) which replaces Florida this year in second place. A total of 44 US states, Canada and Puerto Rico are represented.
2. What is the total square footage of your office and shop combined?
| Less than 1,000 sq. ft. |
|
9%
|
| 1,000-1,999 sq. ft. |
|
12%
|
| 2,000-2,999 sq. ft. |
|
11%
|
| 4,000-4,999 sq. ft.. |
|
9%
|
| 5,000-7,499 sq. ft. |
|
14%
|
| 7,500-9,999 sq. ft. |
|
7%
|
| 10,000-20,000 sq. ft. |
|
11%
|
| More than 20,000 sq. ft. |
|
15%
|
| N/A |
|
1%
|
SPATIAL AWARENESS. Combined shops under 2,000 sq. ft. are up 40% from 2024 and combined shops 10,000 sq. ft. or more are down around 19% — the first of many clues to follow that a slightly higher split of this year’s respondents hail from smaller shops.
3. Where is your company located by region?
| Northeast |
|
26%
|
| Southeast |
|
16%
|
| Midwest |
|
26%
|
| Southwest |
|
8%
|
| West (including Alaska and Hawaii) |
|
20%
|
| Canada |
|
4%
|
4. Where is your company located by setting?
| Office building |
|
2%
|
| Business/industrial park |
|
36%
|
| Strip mall/retail center |
|
7%
|
| Freestanding building |
|
42%
|
| Home office, shop or studio |
|
10%
|
| On the Internet |
|
1%
|
| Other (commercial area, historical town) |
|
2%
|
5. How would you describe the market where your company is located?
| Big urban market |
|
17%
|
| Suburban outskirts of a big urban market |
|
21%
|
| Medium-sized city (250,000-1 million people) |
|
20%
|
| Small city (25,000 to 250,000) |
|
24%
|
| Country town (up to 25,000) |
|
13%
|
| Resort area |
|
3%
|
| Other (combinations of above) |
|
2%
|
CROSS SECTION . No one market type dominates our survey so none of the results should be skewed.
6. Which description of your business do you most closely identify with?
| Full-service sign company (including electric and installation) |
|
53%
|
| Specialized sign company (non-electric or non-installation) |
|
16%
|
| Franchise sign company |
|
8%
|
| Large-format printer |
|
6%
|
| Independent vinyl or vehicle wrap shop |
|
5%
|
| Sign designer, design firm or design agency |
|
3%
|
| Wholesaler (sell to sign companies only) |
|
2%
|
| Sign installer |
|
1%
|
| Other (screen printer, broker) |
|
2%
|
USUAL SUSPECTS. This breakdown falls within a couple of points of previous years’ findings, suggesting the mix of signshop types is fairly steady.

7. Realistically, would you rather live and work somewhere else?
| NO |
|
72%
|
| YES |
|
28%
|
OH, THE PLACES I’D GO. Those who would prefer to be elsewhere from the traditional northern states outnumber those from southern states by more than 3 to 1. Almost as many Californian sign pros would rather not reside in the Golden State as those who would.
8. How long has the company you own/manage/work for been in business?
| Less than 2 years |
|
2%
|
| 2 to 5 years |
|
3%
|
| 5+ to 10 years |
|
11%
|
| 10+ to 25 years |
|
24%
|
| 25+ to 50 years |
|
46%
|
| More than 50 years |
|
14%
|
IMPRESSIVE. The 3 out of 5 combined companies in business for more than a quarter of a century should be encouraging to the combined 5% of companies five years old or less.

9. Check products/services offered by your company:
| ADA signs |
|
67%
|
| Architectural signage |
|
76%
|
| Banners |
|
89%
|
| Billboards |
|
22%
|
| Channel letters |
|
71%
|
| Digital imaging |
|
56%
|
| Electronic displays (EMCs) |
|
49%
|
| Electronic signs (cabinets, etc.) |
|
58%
|
| Foamboard signage |
|
69%
|
| Graphic design |
|
89%
|
| Installation |
|
85%
|
| LED signs |
|
66%
|
| Neon signs |
|
33%
|
| Non-electric changeable copy signs |
|
54%
|
| Sandblasting |
|
29%
|
| Screenprinting materials |
|
21%
|
| Vehicle graphics |
|
82%
|
| Wall/floor graphics |
|
83%
|
| Window graphics |
|
90%
|
| Other (see below) |
|
15%
|
3D printing, apparel, architectural sheet-metal creations, auto décor, awards and gifts, awnings, boat graphics, carved goldleaf signs, canopies, custom artwork and designed signs, dimensional digital signage, event signage, freestanding pylons and monuments, graphic overlays, hand carving, hand lettering, hand painting, laser- and router-cut dimensional letters, laser-engraved signs, light-pole banners and holiday decorations, magnetics, municipal and retail decorating, nameplates, partmarking, portable exhibits, promotional products, special-event graphics, stainless steel fabrication, thermoforming, vacuum-formed sign faces, wallpapers, wayfinding.
10. What were your total sales in 2024? (If you’re Canadian, please convert to US dollars).
| Under $100,000 |
|
9%
|
| $100,000-$249,999 |
|
13%
|
| $250,000-$999,999 |
|
35%
|
| $1,000,000-$5,000,000 |
|
28%
|
| Over $5,000,000 |
|
15%
|
THE $100,000 BAR. Reversing a two-year trend, the portion reporting $1 million or more in total sales plunged by nearly a quarter. Companies under $100,000 are up 125% compared to 2024.
Secrets of Lead Generation
Boost your sales by generating more leads! In this light and lively webinar featuring Maggie Harlow, CEO of Signarama Louisville Downtown (Louisville, KY) and the “Business of Signs” columnist for Signs of the Times, learn the secrets of how leads are generated, where they come from and how you can cultivate better (not just more) leads.


Bulletins
Get the most important news and business ideas from Signs of the Times magazine's news bulletin.
-
 News4 days ago
2026 Women in Signs Awards Winners Announced
-
 Jameson Parker2 weeks ago
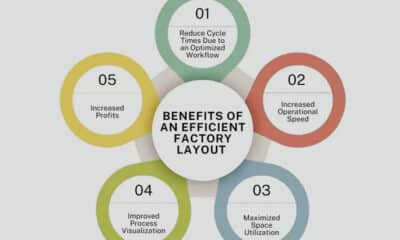
Signshop Layout, Part 1
-

 Business Management1 week ago
Smart Frugality Strategies for Sign Companies
-

 Ask Signs of the Times1 week ago
Creative Ideas to Drive New Sign Business
-
 News2 weeks ago
Girls Who Print Announces 2026 Print HERstory Month
-
 Buzz Session1 week ago
70% of Sign Pros Have an Opinion on Industry Mergers
-
 Russell Toynes2 days ago
Adding That Little Extra to Sign Designs
-
 Signs of the Times2 weeks ago
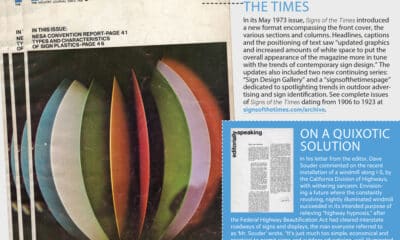
May 1973 Signs of the Times in Tune With Contemporary Sign Design