The following contains some statistics too graphic for some audiences. CPA discretion is advised.
For the complete survey, refer to the January 2010 issue of Signs of the Times, pages 66-72.
All men have had it happen. You’re shaving. You feel the blade dig into your skin. It doesn’t hurt, but you know you really cut yourself. For a second or two, you simply wait to see how much you bleed.
I felt the same way while anticipating the results of this 15th annual Vinyl Survey. This would be the first indicator of how the sign industry fared in 2009. Yes, the State of the Industry (SOI) reports in our July and August issues showed the negative effects of the disastrous last quarter of 2008, but this would be the first documentation of a full year of recession.
This year, to acquire our data, we emailed a survey questionnaire and also posted it on our affiliated website, www.signweb.com.
We definitely had responses from bigger vinyl users this year, based on data that appears contrary at first glance. Even though companies report the highest-ever decline of vinyl use, they also spent approximately 50% more on vinyl than in any other year.
We added one new wrinkle. Instead of just asking if companies perform non-sign work, we also asked what percentage of overall sales such work accounts for.
Remember, “this year” means 2009, and “last year” means 2008. Here are some of the high and lowlights:
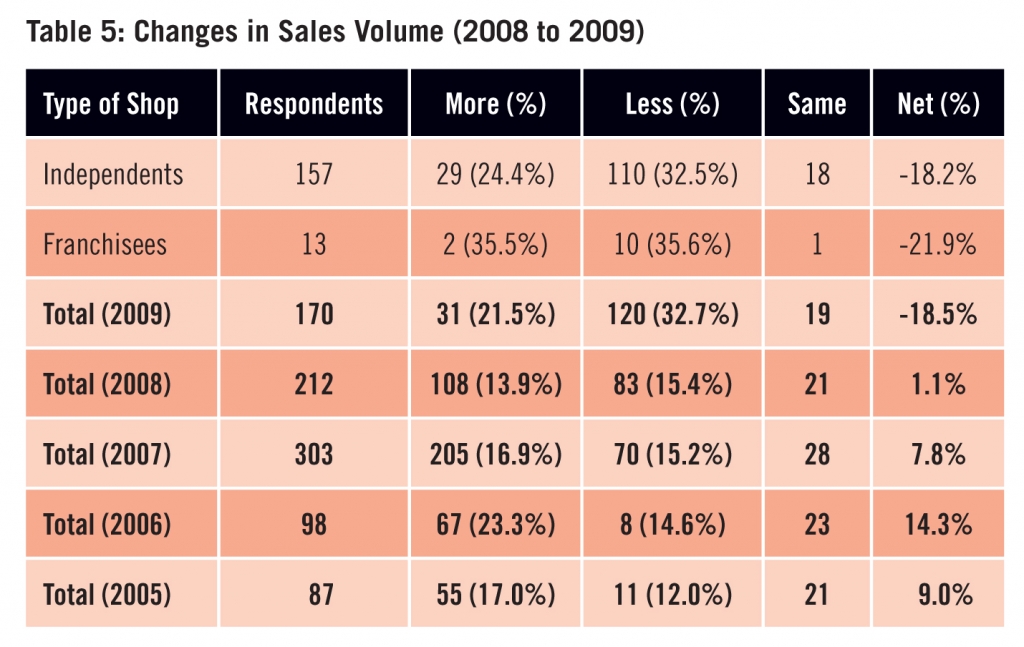
• Just more than 70% of our respondents reported a sales decline in 2009, and on average, their decline was 32% (Table 5). The overall decline was more than 18%.
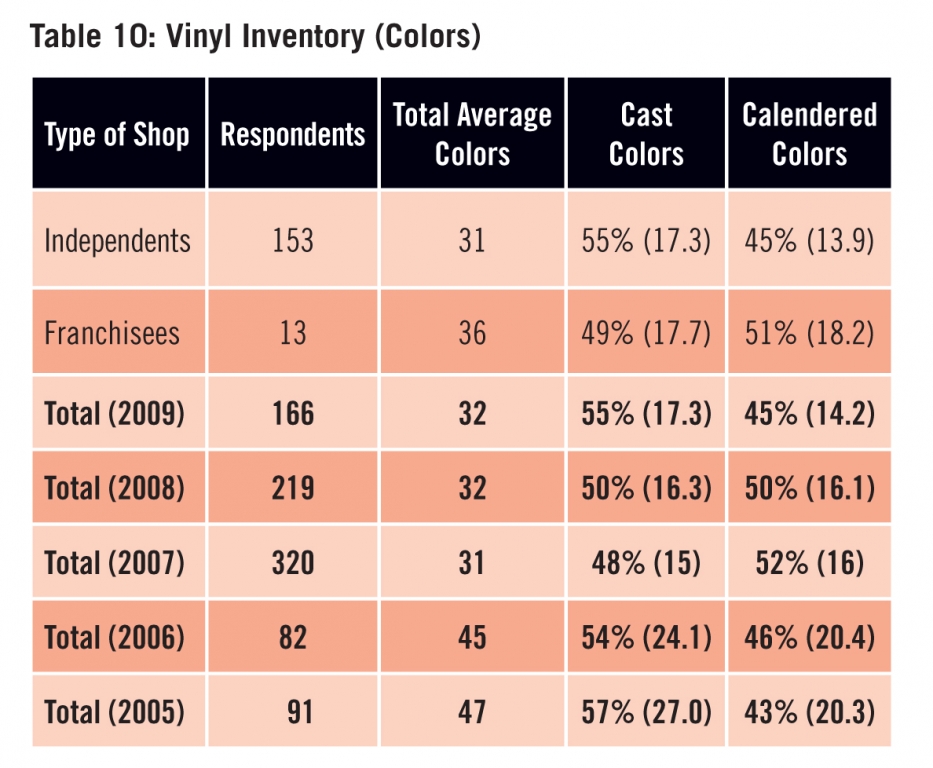
• The average number of calendered-vinyl colors sign companies are keeping in stock (14) is at an all-time low (Table 10). However, the average number of cast colors increased for the second consecutive year.
The respondents
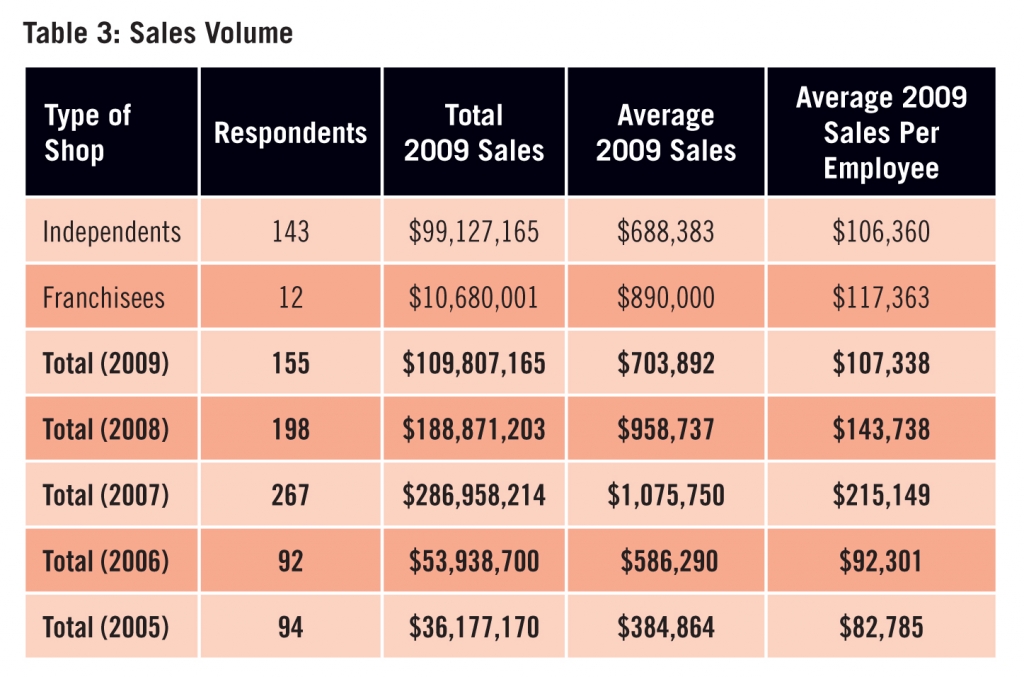
This year, we were pleased to receive 176 responses (Table 1). In Table 3, with regard to sales volume, you’ll see a significant line of demarcation between 2005 and 2006. Again, that’s when we began posting the survey online. Why does that matter? Previously, we only mailed the survey to nonelectric-sign companies. Now, with the survey posted online, any type of sign company may respond, and the average electric-sign company is typically 4-8 times larger than the average commercial (non-electric) sign company.
So, even though this year’s average sales volume is the third highest ever, at more than $700,000, it’s also significantly the lowest in the “electric” era. The same scenario holds true for sales per employee.
The change in annual sales volume, reflected in Table 5, presents perhaps the most pervasive and depressing statistic in this study. As noted above, more than 70% of the respondents suffered declining sales in 2009. And we must assume the overall decline of 18.5% doesn’t come close to representing the decline of the sign industry as a whole. Why? Simply because sign companies that went out of business in 2009 can’t respond (although one did). If you add numerous 100%-decline figures, that 18.5% rapidly rises. As it was, 31 respondents (18%) reported a sales decline of at least 50%.
But we should also note that 18% of the respondents enjoyed a better year in 2009, and their average sales-volume increase was 25.1%. Obviously, the smaller your company, the easier it is to increase your sales volume by a sizeable margin. Only three of the 31 companies that enjoyed better sales in 2009 reported sales of more than $1 million. By far, the most successful respondent increased its sales by 40% in 2009 to $2.5 million.
Vinyl usage
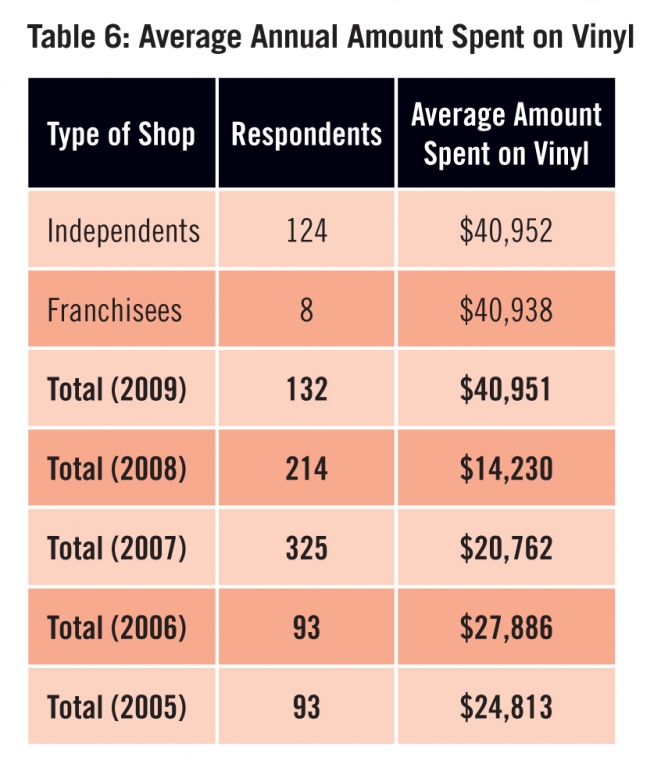
Table 6 presents the most curious statistic in this study. It seemingly represents a huge boom in vinyl usage as the average figure of nearly $41,000 is approximately 50% higher than in any previous study. In stark contrast, however, the following Table 7 simultaneously reports that vinyl usage dropped by an average of more than 11% in 2009. Perhaps the only explanation is this year’s respondents are inordinately vinyl-oriented, because Table 1 doesn’t indicate respondents are significantly bigger.
Similarly, if we co-examine Tables 5 and 7, we can safely say vinyl usage accelerated in 2009 as a percentage of sales. After all, sales declined by 18.5%, while vinyl usage only declined by 11.6%. (We feel your pain. In 2009, although ST grabbed more marketshare in ads from our competitors, we suffered a sharp decline in overall ad sales.) Roughly one-sixth of the respondents simply bought more vinyl in 2009.
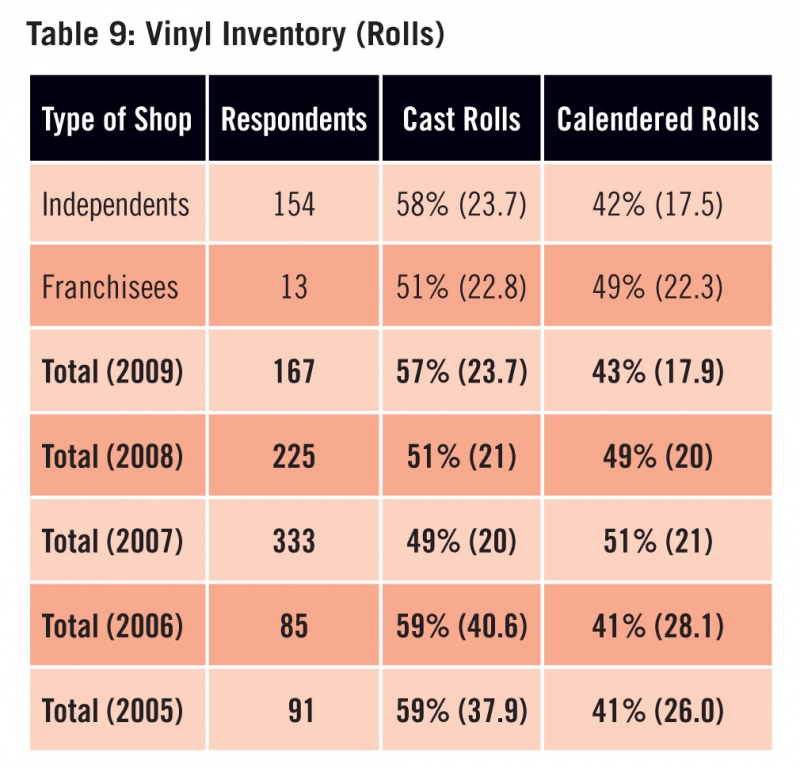
Given the stark dichotomy of vinyl purchasing evidenced in Tables 6 and 7, we contrastingly see remarkable stability in Tables 9 and 10. In the former, we see the number of cast and calendered rolls of vinyl kept in stock has remarkably remained constant at 41 and 42. Likewise, in terms of the number of colors of each type of vinyl, here, too, the figure has remained stalwart between 31 and 32 each of the past three years. Otherwise, the common thread in the two tables is a slight trend back toward cast vinyl. Whereas cast had always been the undisputed favorite, calendered actually had the upper hand for one year in 2007.
Click here to purchase the January 2010 print edition with the complete report.
Advertisement


 Tip Sheet2 weeks ago
 Photo Gallery4 days ago
 Ask Signs of the Times5 days ago
 Real Deal2 weeks ago

 Benchmarks1 week ago

 Women in Signs2 weeks ago