Sign Companies’ Basic Demographics
Types, sizes and locations of shops, company sales, longevity and more.
WE START OUR “DOCUMENTARY” of sign companies by getting acquainted with where our respondents are from, their office/shop sizes, how long they’ve been in business — but also: Are they happy with where they live and work? Spoiler: Most are, but how many? Read on!
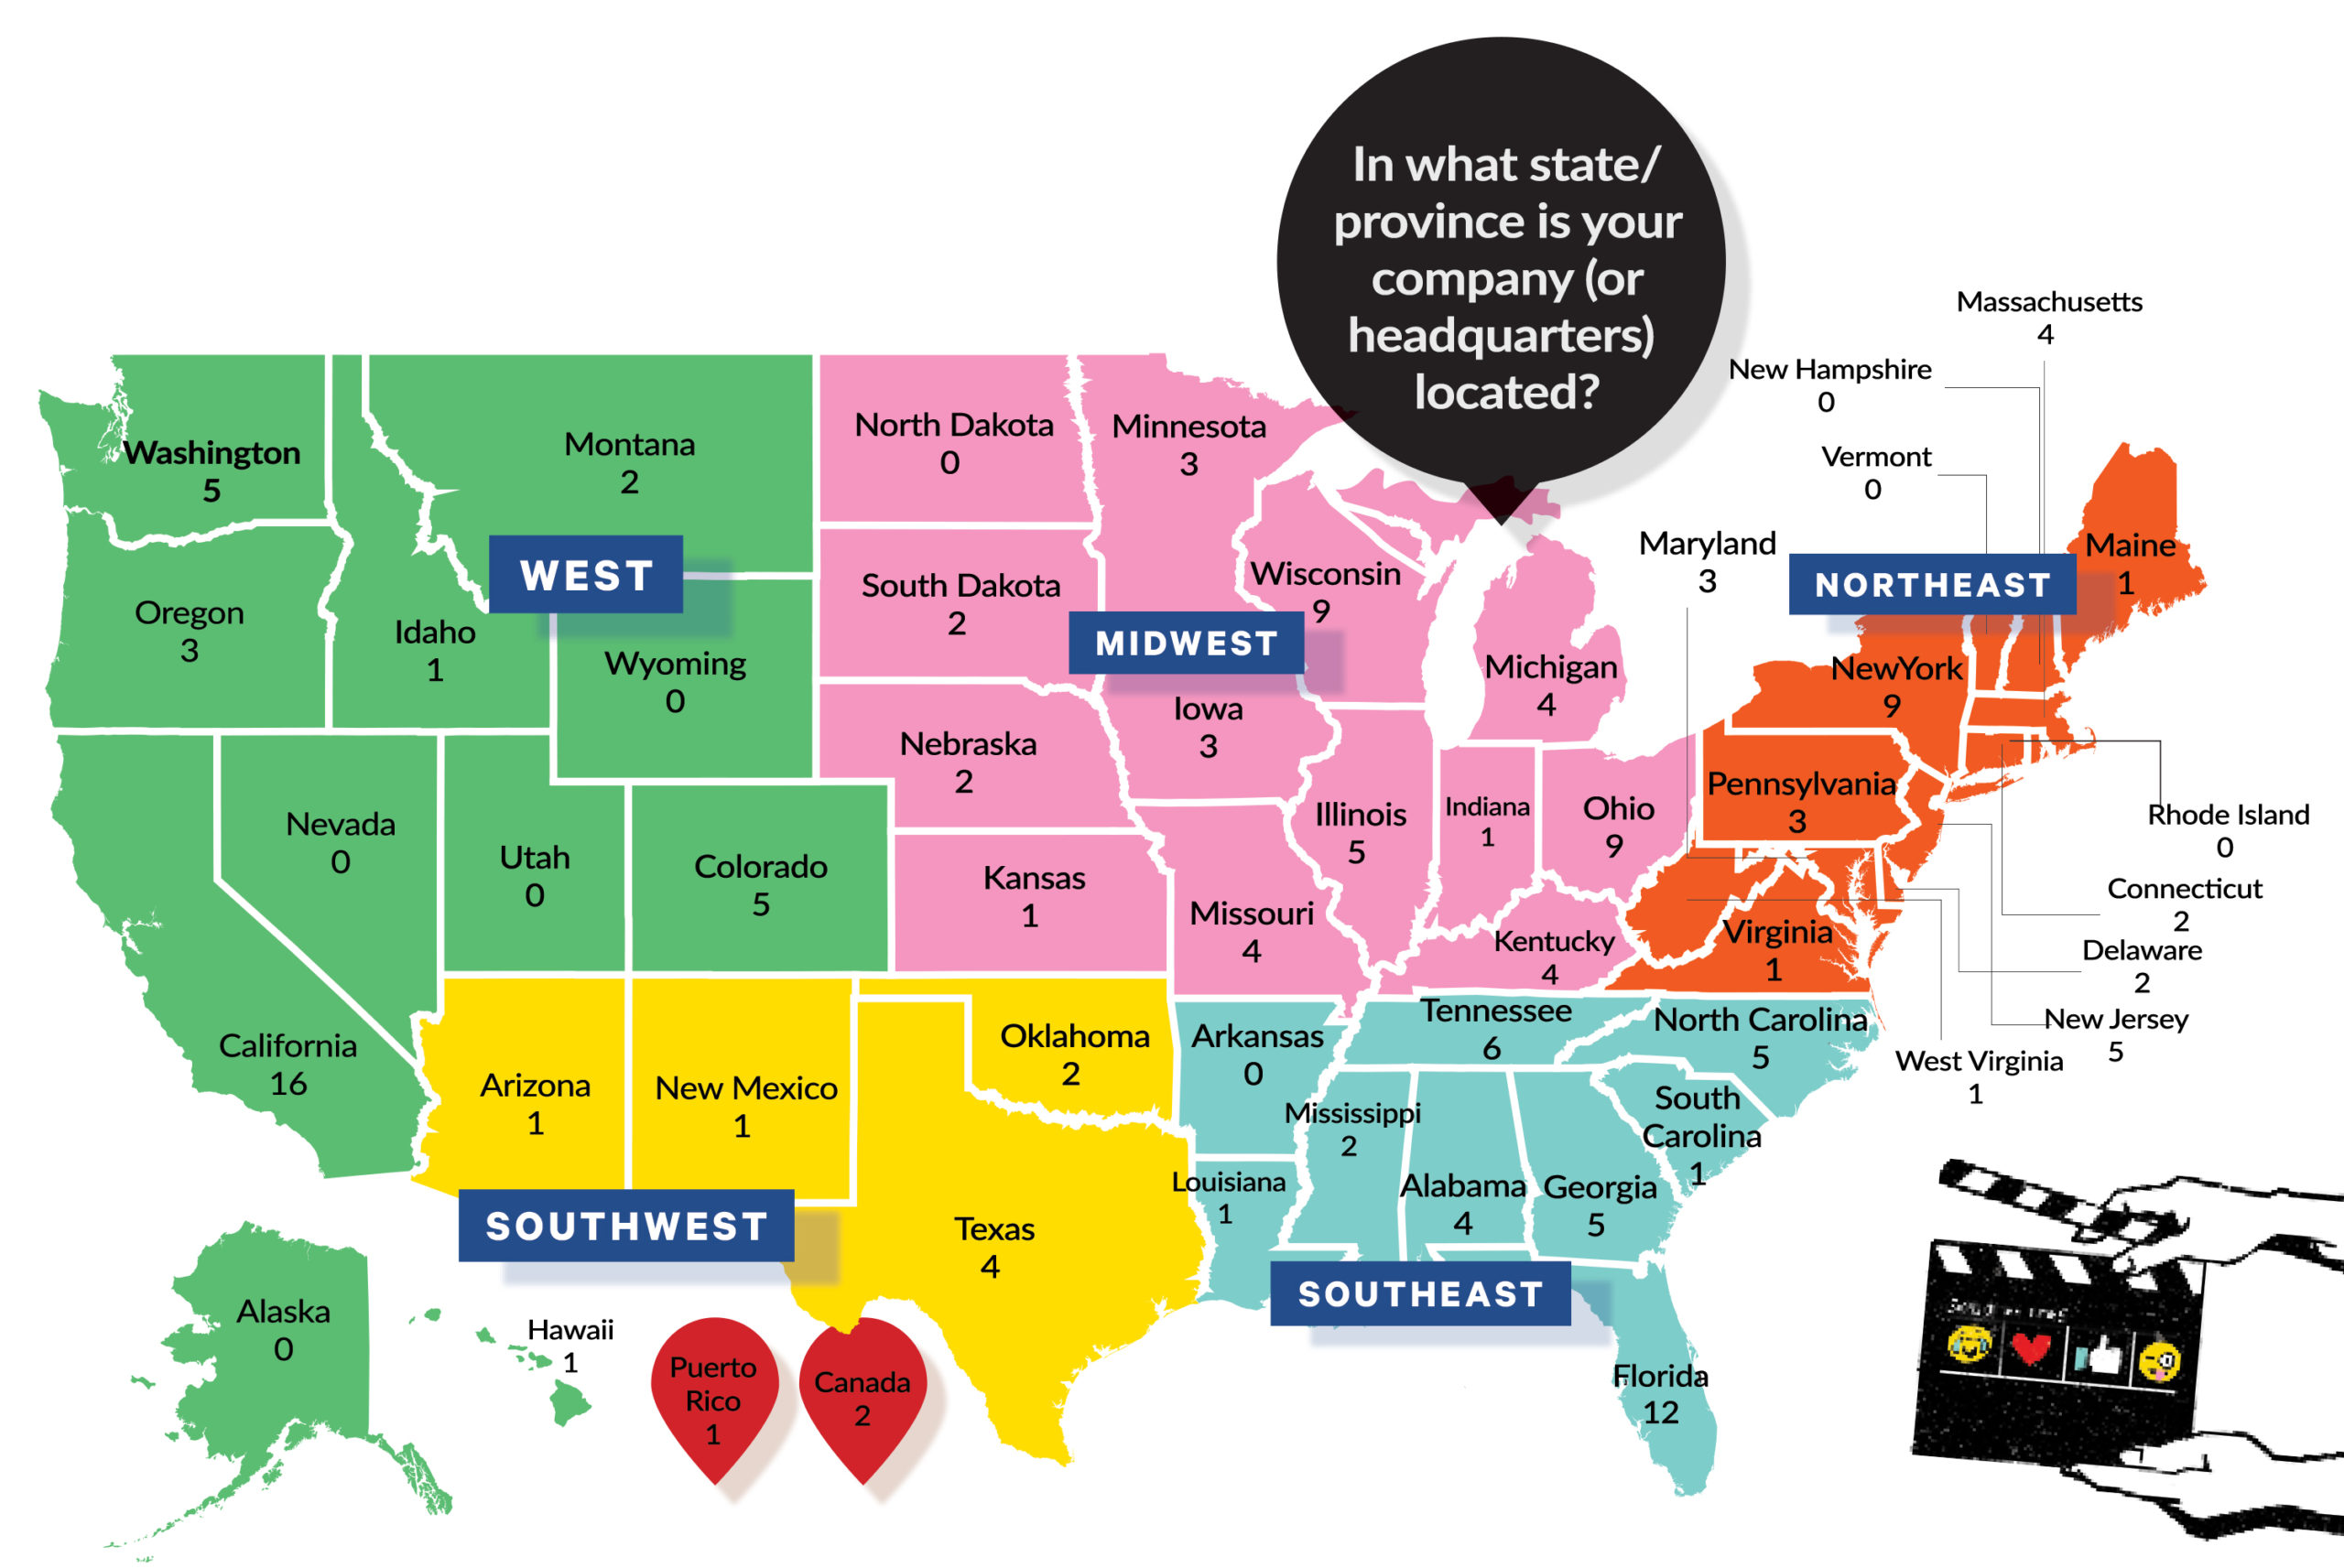
GEOGRAPHICALLY DIVERSE. As expected, California is home to the most respondents of any state (16), followed by Florida (12) which overtakes New York this year for second spot. A total of 41 states, Canada and Puerto Rico are represented.
2. What is the total square footage of your office and shop combined?
| Less than 1,000 sq. ft. |
|
6%
|
| 1,000-1,999 sq. ft. |
|
9%
|
| 2,000-2,999 sq. ft. |
|
14%
|
| 3,000-3,999 sq. ft. |
|
9%
|
| 4,000-4,999 sq. ft. |
|
9%
|
| 5,000-7,499 sq. ft. |
|
10%
|
| 7,500-9,999 sq. ft. |
|
7%
|
| 10,000-20,000 sq. ft. |
|
15%
|
| More than 20,000 sq. ft. |
|
17%
|
| N/A |
|
4%
|
GOING BIG… AND SMALL. More respondents reported their total office/shop square footage to be both smaller (under 3,000 sq. ft.) and larger (7,500 sq. ft.) than last year, leaving fewer medium-sized companies (3,000-7,499 sq. ft.). Shops over 20,000 sq. ft. rose 42% from 2023.
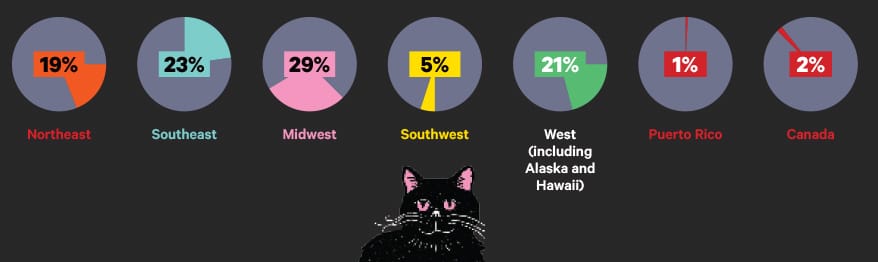
3. Where is your company located by region?
4. Where is your company located by setting?
| Office building |
|
2%
|
| Business/industrial park |
|
38%
|
| Strip mall/retail center |
|
7%
|
| Freestanding building |
|
44%
|
| Home office, shop or studio |
|
6%
|
| On the Internet |
|
1%
|
| Other (multiple locations) |
|
2%
|
5. How would you describe the market where your company is located?
| Big urban market |
|
19%
|
| Suburban outskirts of a big urban market |
|
18%
|
| Medium-sized city (250,000-1 million people) |
|
26%
|
| Small city (25,000 to 250,000) |
|
23%
|
| Country town (up to 25,000) |
|
9%
|
| Resort area |
|
2%
|
| Other (multiple locations) |
|
3%
|
MARKET COVERAGE. A roughly equivalent portion of sign companies claim urban, suburban, medium-sized and small-city locations. Medium cities gained 5% compared to last year, with that amount roughly lost by the other three.
6. Which description of your business do you most closely identify with?
| Full-service sign company (including electric and installation) |
|
53%
|
| Specialized sign company (non-electric or non-installation) |
|
18%
|
| Franchise sign company |
|
7%
|
| Large-format printer |
|
7%
|
| Independent vinyl or vehicle wrap shop |
|
4%
|
| Sign designer, design firm or design agency |
|
2%
|
| Wholesaler (sell to sign companies only) |
|
5%
|
| Sign installer |
|
1%
|
| Other (manufacturer, university shop) |
|
3%
|
STABILITY. Full-service companies clocked in at the exact same rate as last year. Specialized shops also held steady, down just a point. Franchises bounced back from 2023’s 4%, nearly reaching 2022’s 8%.
7. Check products/services offered by your company:
| ADA signs |
|
63%
|
| Architectural signage |
|
73%
|
| Banners |
|
82%
|
| Billboards |
|
20%
|
| Channel letters |
|
71%
|
| Digital imaging |
|
62%
|
| Electronic displays (EMCs) |
|
50%
|
| Electronic signs (cabinets, etc.) |
|
58%
|
| Foamboard signage |
|
64%
|
| Graphic design |
|
87%
|
| Installation |
|
82%
|
| LED signs |
|
66%
|
| Neon signs |
|
39%
|
| Non-electric changeable copy signs |
|
58%
|
| Sandblasting |
|
29%
|
| Screenprinting materials |
|
27%
|
| Vehicle graphics |
|
70%
|
| Wall/floor graphics |
|
75%
|
| Window graphics |
|
81%
|
| Other (see below) |
|
15%
|
ALPHABET SOUP. ACM/cladding, aluminum signs, art and sculpture fabrication, auto decor, awards and plaques, awnings and canopies, braille tactile, carving HDU, casino theming, CNC and laser routing, Coroplast signs, crane services, decals and stickers, Di-NOC vinyl, embroidery, etching, flags and flagpoles, hand lettering, heat press, logo/branding packages, motocross graphics, real estate signs, rigid interior/exterior signs, sublimation, sun-control systems, wayfinding planning and design, wood products, yard signs
8. Are you happy with where you live and work?
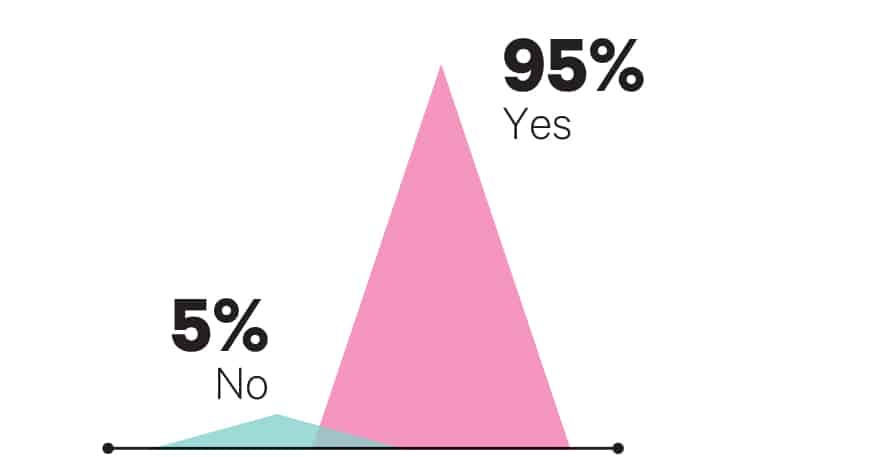
FIGHTING ILLINI. Among the very few unhappy with where they live and work, the only locations named more than once are big urban settings in Illinois. Sorry, Chicago!
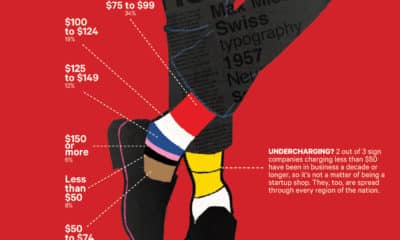
9. What were your total sales in 2023? (If you’re Canadian, please convert to US dollars).
| Under $100,000 |
|
4%
|
| $100,000-$249,999 |
|
10%
|
| $250,000-$999,999 |
|
30%
|
| $1,000,000-$5,000,000 |
|
40%
|
| Over $5,000,000 |
|
16%
|
MILLIONAIRES CLUB FOR GROWTH. Continuing 2023’s trend over 2022, reported sales generally filtered up our range, with $1 million totals up 38% from last year’s portion (29%). Keep it going!
10. How long has the company you own/manage/work for been in business?
| Less than 2 years |
|
0%
|
| 2 to 5 years |
|
3%
|
| 5+ to 10 years |
|
8%
|
| 10+ to 25 years |
|
29%
|
| 25+ to 50 years |
|
41%
|
| More than 50 years |
|
19%
|
LONGEVITY. The number of sign companies in business longer than 25 years, a combined 60%, is up 5% compared to last year. Most ticked up from 10+ to 25 years, so were a fair number of 25th anniversaries celebrated in the previous 12 months?


Canon U.S.A. to Host Webinar on AI Integration in Business

21 Highlights from the American Sign Museum Main Street Expansion

From Chips to Hip


Bulletins
Get the most important news and business ideas from Signs of the Times magazine's news bulletin.
-

 Tip Sheet2 weeks ago
Sign Tips for Construction Fence Graphics and CNC Tables
-

 Real Deal2 weeks ago
A Wrap Shop Plots to Take Back a Poached Installer
-

 Paula Fargo3 days ago
Selling Your Sign Company Via the Franchising World
-
 Photo Gallery20 hours ago
21 Highlights from the American Sign Museum Main Street Expansion
-
 Signs of the Times4 days ago
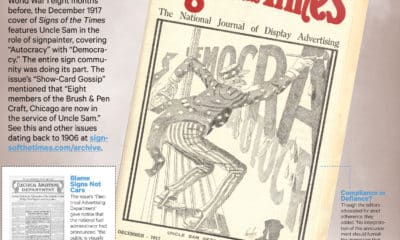
December 1917 Signs of the Times Cover: Safe for Democracy
-

 News1 week ago
MUTOH Introduces New Single-Pass ADA Features
-

 Special Report1 week ago
The Wide World of Non-English Signs
-

 News2 weeks ago
Wells Fargo Sign Removed From Jacksonville Tower