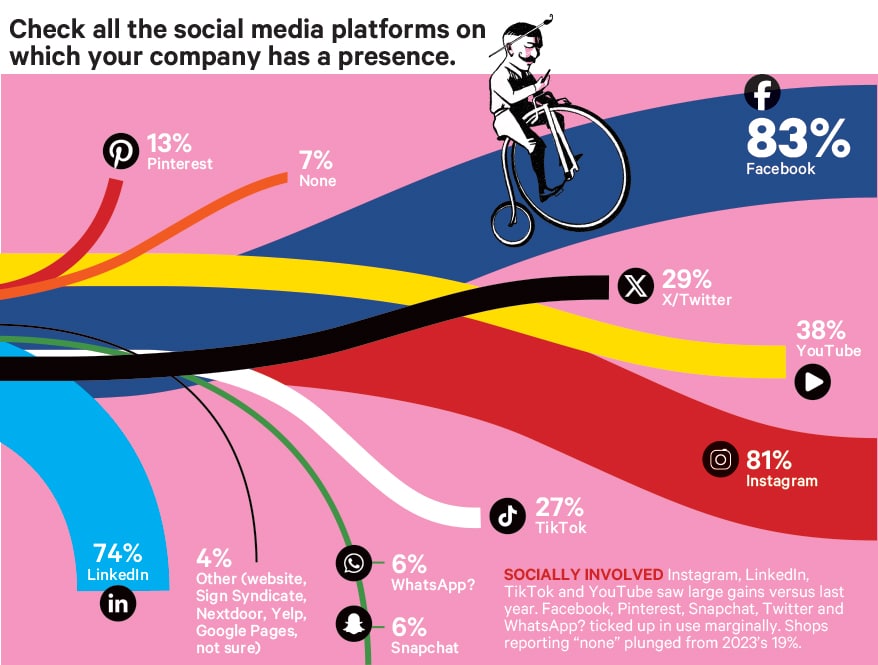
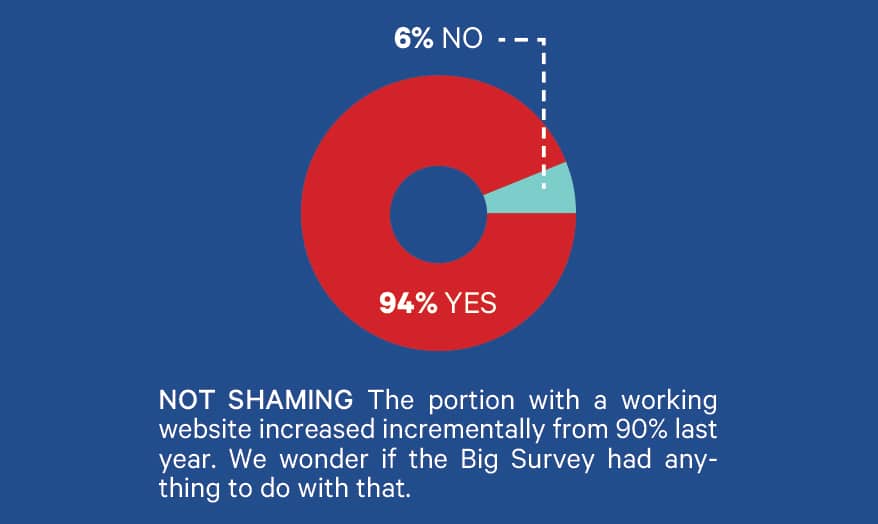
SIGN COMPANIES WE reached are present on more social media platforms than before, though trackable leads and referrals remain fairly insignificant. Slightly more shops report working websites though 3 in 10 are unhappy with them, perhaps because they’re not updated as often as owners and top managers would like.
57. How would you describe the contribution of your social media to trackable job referrals?
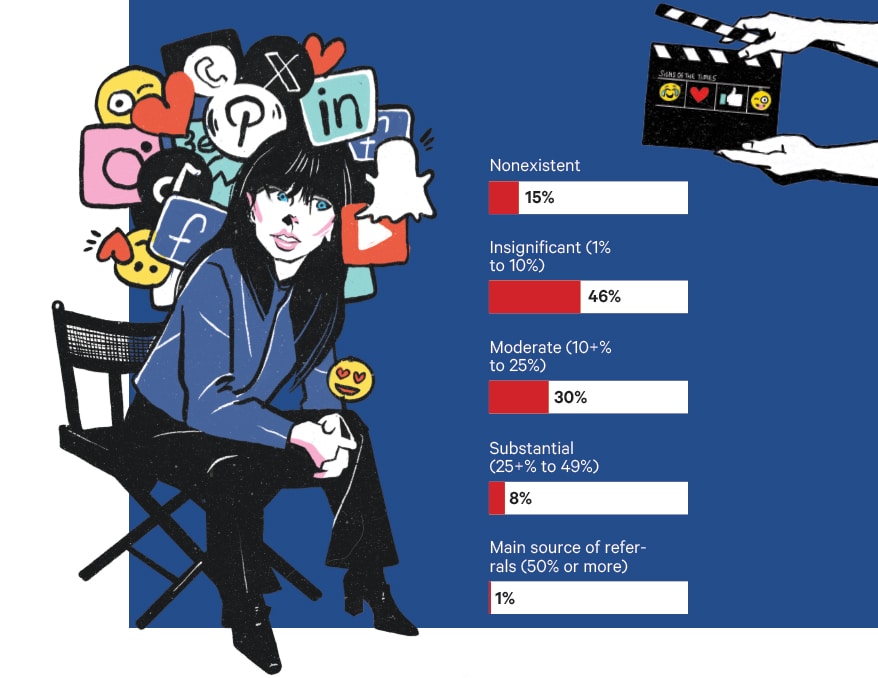
FOR REAL? The number of respondents describing the contribution of their social media to trackable job referrals as moderate, substantial and the main source of referrals (combined) has fallen from 42% in 2022 and 2023 to 39% this year.
58. Who oversees your social media accounts?
| Me (the owner/top manager) |
|
43%
|
| Staff member who holds another role |
|
30%
|
| Dedicated in-house social media manager |
|
5%
|
| Family member |
|
5%
|
| Freelance social media consultant |
|
2%
|
| Social media or PR agency |
|
5%
|
| It’s a team effort |
|
4%
|
| Other (franchisor, owning company, outside professional, no social media) |
|
6%
|
SOCIAL MANAGEMENT. Owners/top managers overseeing their social media accounts have increased incrementally from 36% in 2022 to 39% in 2023 to 43% this year.
59. Which social media platform is the most impactful for your business (in terms of lead generation and sales conversions)?
| Me (the owner/top manager) |
|
43%
|
| Staff member who holds another role |
|
30%
|
|
41%
|
|
13%
|
|
1%
|
| X/Twitter |
|
1%
|
| YouTube |
|
1%
|
|
13%
|
| TikTok |
|
0%
|
| Snapchat |
|
0%
|
| WhatsApp? |
|
0%
|
| None |
|
25%
|
| Other (website, Google, Yelp) |
|
5%
|
NOT IMPRESSED. Two years ago, 3 in 10 participants reported “none” — no platform was impactful to leads or sales; last year, 1 in 3; now 1 in 4. Despite the surge in Instagram presence, its impact is unchanged.
61. Which one social media platform does your company currently not have a presence on, but you plan to or would like to start one?
|
2%
|
|
10%
|
|
4%
|
| X/Twitter |
|
3%
|
| YouTube |
|
14%
|
|
5%
|
| TikTok |
|
17%
|
| Snapchat |
|
2%
|
| WhatsApp? |
|
1%
|
| None |
|
40%
|
| Other (Nextdoor, guerrilla marketing, all of them) |
|
2%
|
NONE IS THE NUMBER. TikTok and YouTube lead the way again, though their percentages are down from last year. Meanwhile, “none” doubled from 2023’s findings, suggesting that most shops are already present on just about every social media platform they want to be.
62. Does your company have its own working website?
63. Are you mostly happy with the state and/or contents of your website?
| YES |
|
70%
|
| NO |
|
30%
|
CONSTRUCTION SITES. 3 in 4 owners and managers not happy with their websites are planning to significantly update them.
64. Are you planning to start a new website or significantly update your current site?
| YES |
|
42%
|
| NO |
|
58%
|
NET GAINS. Half of shops currently without a working website plan to start one.
65. How often does your company update its website?
| Daily |
|
0%
|
| Couple/few times a week |
|
1%
|
| Weekly |
|
5%
|
| Every couple/few weeks |
|
7%
|
| Monthly |
|
13%
|
| Sporadically/when time allows |
|
41%
|
| Very seldom |
|
28%
|
| Never |
|
5%
|
66. How often would you like your company to update its website?
| Daily |
|
2%
|
| Couple/few times a week |
|
6%
|
| Weekly |
|
14%
|
| Every couple/few weeks |
|
15%
|
| Monthly |
|
41%
|
| Sporadically/when time allows |
|
20%
|
| Very seldom |
|
1%
|
| Never |
|
1%
|
HERE’S HOW. For the second year in a row, responses regarding website updates both actual and desired remained steady with the vast portion wanting updates done more frequently. There’s an easy (if not free) way to do that, you know.
Introducing the Sign Industry Podcast
The Sign Industry Podcast is a platform for every sign person out there — from the old-timers who bent neon and hand-lettered boats to those venturing into new technologies — we want to get their stories out for everyone to hear. Come join us and listen to stories, learn tricks or techniques, and get insights of what’s to come. We are the world’s second oldest profession. The folks who started the world’s oldest profession needed a sign.


NUtec Digital Ink Invests in Solar Energy for Facility

5 Reasons to Sell a Sign Company Plus 6 Options

21 Larry Albright Plasma Globes, Crackle Tubes and More


Bulletins
Get the most important news and business ideas from Signs of the Times magazine's news bulletin.
-

 Tip Sheet2 weeks ago
Always Brand Yourself and Wear Fewer Hats — Two of April’s Sign Tips
-
 Photo Gallery4 days ago
30 Snapshots of the 2024 ISA Sign Expo
-

 Ask Signs of the Times6 days ago
Why Are Signs from Canva so Overloaded and Similar?
-
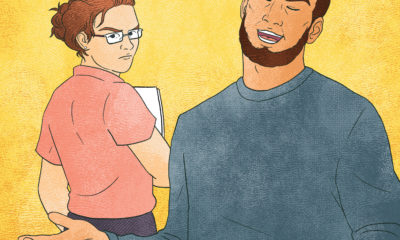
 Real Deal2 weeks ago
A Woman Sign Company Owner Confronts a Sexist Wholesaler
-
 Paula Fargo1 day ago
5 Reasons to Sell a Sign Company Plus 6 Options
-
 Benchmarks1 week ago
6 Sports Venue Signs Deserving a Standing Ovation
-
 Photo Gallery1 day ago
21 Larry Albright Plasma Globes, Crackle Tubes and More
-

 Women in Signs2 weeks ago
2024 Women in Signs: Megan Bradley